The Electricity (Power) Grid
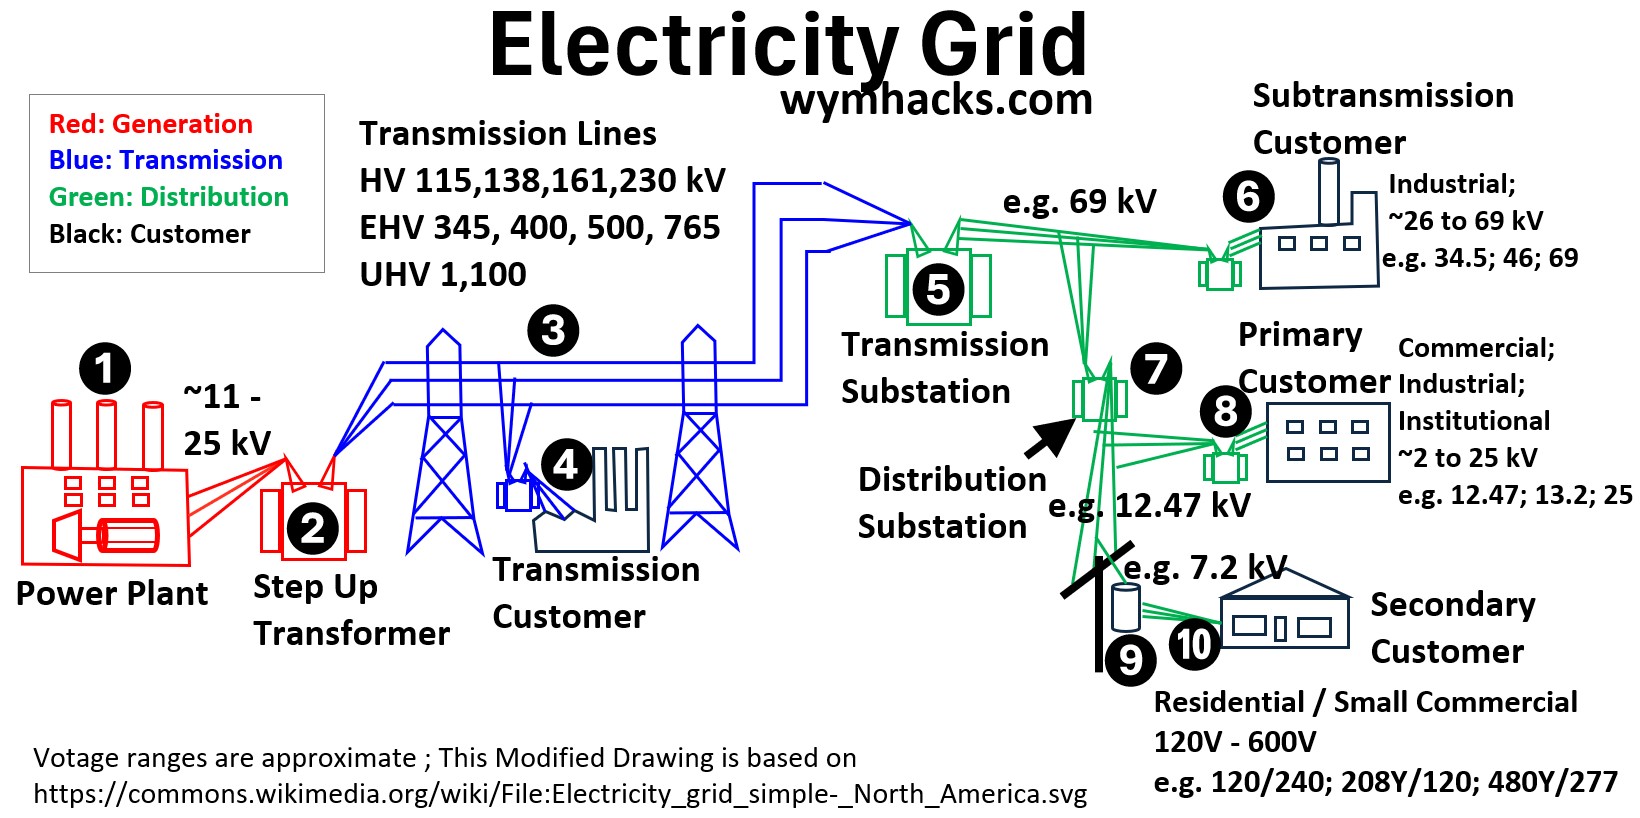
The electrical power grid is a vast, complex, interconnected network designed to deliver electricity from where it’s generated (power plants) to where it’s consumed (homes, businesses, and industries).
It’s primary function is to continuously and reliably balance the supply of electricity with the real-time demand across a wide geographic area.
Picture: Electricity Grid
The Three Core Components of the Power Grid
Generation (#1 in the drawing above)
This is where electrical energy is produced.
Power plants use various energy sources—including fossil fuels (coal, natural gas), nuclear fission, and renewables (hydro, wind, solar)—to create electricity.
Transmission (#3, #4 in the drawing above)
After generation at location #1, in the 11 to 25 kilo volt range (typical; kilo volt = 1000s volts = kV) , the voltage is dramatically stepped up at a substation (#2 in the drawing) to hundreds of thousands of volts (e.g. 138 kV, 230 kV, 345 kV, 500 kV, 765 kV, and higher!!).
This high voltage is necessary to move large amounts of power
- efficiently over long distances with minimal energy loss (primarily as heat)
- through high-voltage transmission lines
- which are typically held up by tall, metal towers.
High voltage means low current which means less power loss during transmission (see Appendix 1 for more details on why this is true).
Transmission Customer (#4 in the drawing above)
In a deregulated and competitive wholesale electricity market, the transmission customer is the entity that pays the federally regulated fee (tariff) to have electricity transported from a point of generation to a point of distribution or direct consumption.
Transmission customers are large-scale energy entities—not residential users—that pay a fee to move vast amounts of power across the high-voltage grid.
The main types include:
- Load-Serving Entities (LSEs) / Utilities: They deliver power to homes and businesses.
- Power Generators: They transmit electricity from power plants to the market.
- Large Industrial Users: They connect directly to the grid for high-volume needs.
- Power Marketers/Brokers: They move and trade electricity between sellers and buyers.
This system is essential for Open Access and market competition, requiring grid owners to offer comparable transmission service to all eligible parties, fostering a competitive wholesale electricity market.
Distribution
An electrical distribution system is the final stage of the electrical grid, responsible for safely and reliably delivering power from the high-voltage transmission network to the end-use customer.
It is characterized by multiple, successive voltage reductions.
Distribution (#5): Substation Step-Down Transformer
This large transformer is the gateway from the transmission grid to the distribution grid.
- Function: It receives extremely high voltage power (e.g., 345 kV) from the transmission network and steps it down to a lower, medium voltage suitable for local distribution.
- Role: This voltage reduction is necessary because the high voltages used for long-distance transmission are unsafe and impractical for delivery within neighborhoods and cities.
Distribution (#6): Sub-transmission Customer
This is a very large consumer that connects to the high end of the distribution system, often referred to as the sub-transmission network.
- Voltage: Connects directly to medium-high voltage lines, typically 34 kV to 69 kV.
- Profile: These are generally massive industrial facilities, large utility hubs, large data centers, or institutions (like a university campus or major hospital) that require a substantial and highly reliable power supply.
- They often have their own dedicated on-site substation to manage the power they receive.
Distribution Substation/Transformer (#7) :
This will be that neighborhood substation that provides the voltage via the power lines to your house.
So for example, 69 kV might be stepped down to 12.47 kV which is what travels down the poles to near your house.
Distribution (#8): Primary Customer
A large-to-medium volume customer that connects directly to the primary distribution lines.
- Voltage: Connects to medium voltage lines, typically 4 kV to 25 or higher kV, which are the main power lines leaving the distribution substation (often seen running pole-to-pole along streets)
- Profile: This includes industrial parks, large commercial buildings, shopping malls, and large schools.
- Like sub-transmission customers, they often have their own transformer on their property to reduce the medium voltage to a usable internal voltage (e.g., 480V or 208V).
Distribution: (#10) Secondary Customer
The vast majority of residential and small commercial customers are secondary customers.
- Voltage: Connects to the final, low-voltage lines known as the secondary circuits, which deliver power at utilization voltage (e.g., 120/240V in the U.S.).
- Profile: This includes individual homes, small offices, neighborhood businesses, and street lighting.
- Their connection is made after the power passes through a small pole-mounted or pad-mounted distribution transformer (#9 in the above drawing) that reduces the primary voltage down to the final service voltage.
Notice that there is a single line takeoff from the three line pole.
- For example, a 12.47 kV 4 wire supply (3 voltages line plus a neutral line) can provide a single line voltage of 7.2kV (its really a “hot” line and a neutral line) to your local pole mounted “can” transformer.
- The primary side of the pole mounted transformer will step down the 7.2 kV to 240V and 120V
The Critical Challenge: Real-Time Balance
The most challenging aspect of operating the grid is maintaining a constant, precise balance between the electricity being generated and the electricity being consumed.
Unlike natural gas or water, electricity cannot be easily stored on a massive scale (though battery storage is changing this).
- If power supply temporarily exceeds demand, the grid frequency rises, which can damage equipment.
- If demand exceeds supply, the frequency drops, which can lead to cascading failures and widespread blackouts.
Grid operators use sophisticated control systems to monitor demand and adjust generation in real-time to keep the system’s frequency and voltage stable, ensuring that when you flip a switch, the power is instantly available.
Power Plant Types Overview
We now want to delve into power plant generation of electricity (#1 in our power grid picture above).
A power plant is an industrial facility used to generate electricity from a primary source of energy.
Its fundamental function is to convert various forms of energy (chemical, thermal, mechanical, solar, nuclear, etc.) into electrical power suitable for transmission across an electrical grid.
A power plant is also frequently referred to by the following terms:
- Power Station
- Generating Station
- Generating Plant
Power plants are broadly categorized by the primary energy source they use.
- those that rely on a thermal cycle (heat → mechanical motion → electricity generation) or
- a direct mechanical cycle (mechanical motion → electricity generation) or a
- a direct non-mechanical cycle. (Photovoltaics or Batteries/Fuel Cells → electricity generation)
The traditional large centralized power plants are going to be (overwhelmingly) of the thermal cycle type.
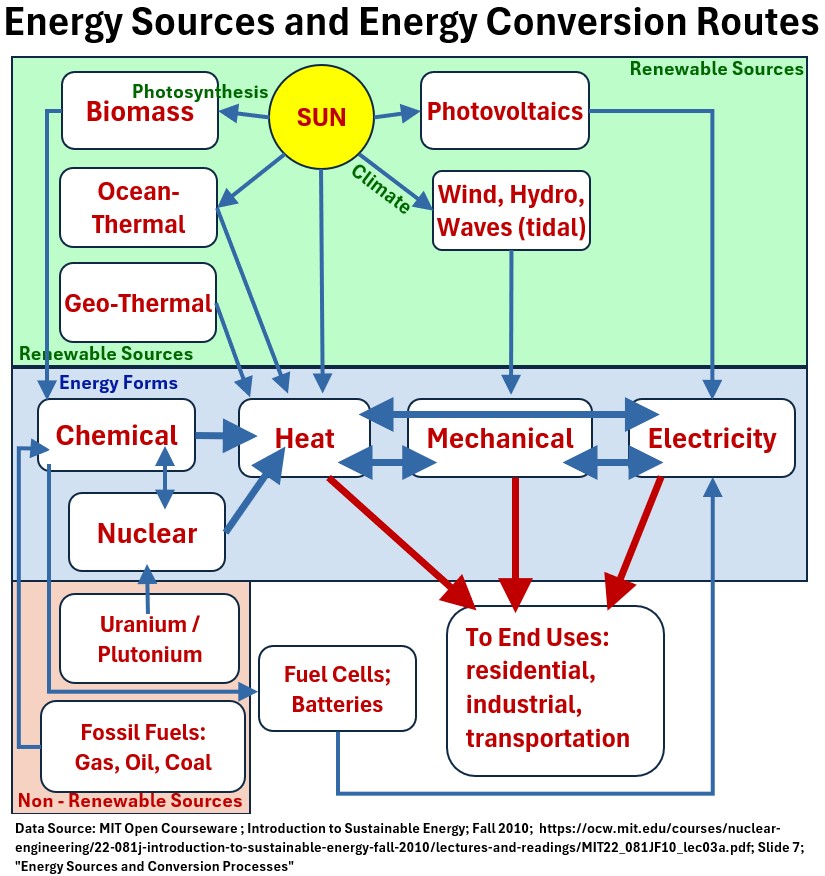
As we go through the various types of plants, it helps to keep the schematic below in mind.
Very Nice (Its based on a chart generated by someone at MIT).
- It shows the various energy conversion paths that produce electricity,
- and it is a definitive one chart proof of why Humans are the dominant species on earth.
Picture: Energy Sources and Energy Conversion Routes
Thermal Power Plants (Heat → Mechanical → Electrical)
These plants use heat to boil water, creating high-pressure steam to spin a turbine, which then drives an electrical generator.
Picture: Thermal Energy Power Generation Schematic
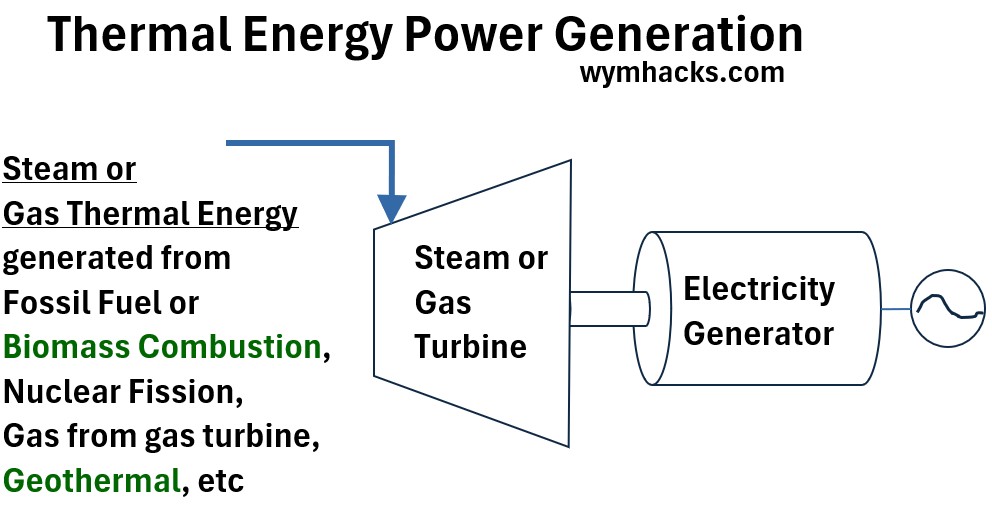
- Fossil Fuel Plants: Burn fossil fuel to provide the heat needed to generate steam which drives turbines to generate electricity.
- Coal-fired
- Natural Gas-fired (often uses a combined cycle—gas turbine + steam turbine—for higher efficiency)
- Oil-fired
- Nuclear Power Plants: Use controlled nuclear fission (splitting of atoms) to generate the heat needed to create steam.
- Geothermal Power Plants: Harness natural heat from the Earth’s interior (e.g., steam or hot water) to drive turbines.
- Biomass Power Plants: Burn organic material (wood chips, crop residue, waste) to generate steam.
- Concentrated Solar Power(CSP): A CSP plant uses an array of mirrors or lenses to focus a large area of sunlight onto a receiver to generate high-temperature heat, which is then used to run a conventional steam turbine to produce electricity.
Direct Mechanical Power Plants (Mechanical → Electrical)
Technically, we are defining “direct” here to mean a non-heat conversion path.
These plants use the physical force of a moving fluid (water or wind) or a direct energy conversion process (sunlight) to generate electricity.
Picture: Mechanical (Kinetic) Energy Power Generation Schematic
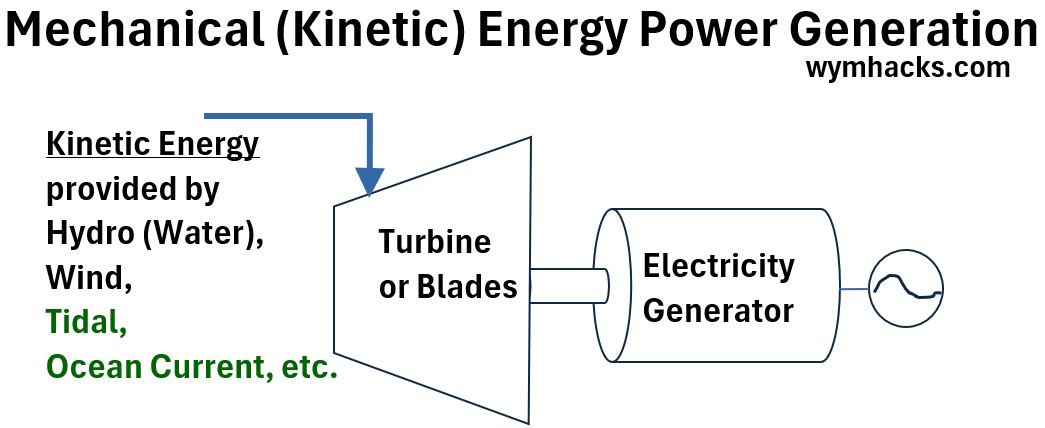
- Hydroelectric Power Plants: Use the gravitational force of falling or flowing water to spin a turbine.
- Wind Power Plants: Use the kinetic energy of the wind to rotate turbine blades.
- Marine Power Plants:
- Tidal Power: Uses the rise and fall of ocean tides to turn turbines.
- Wave Power: Uses the movement of ocean waves.
Direct Non-Mechanical Power Plants (Chemical or Photovoltaic → Electrical)
Technically, we are defining “direct” here to mean a non-heat conversion path.
Picture: Solar Energy Power Generation Schematic
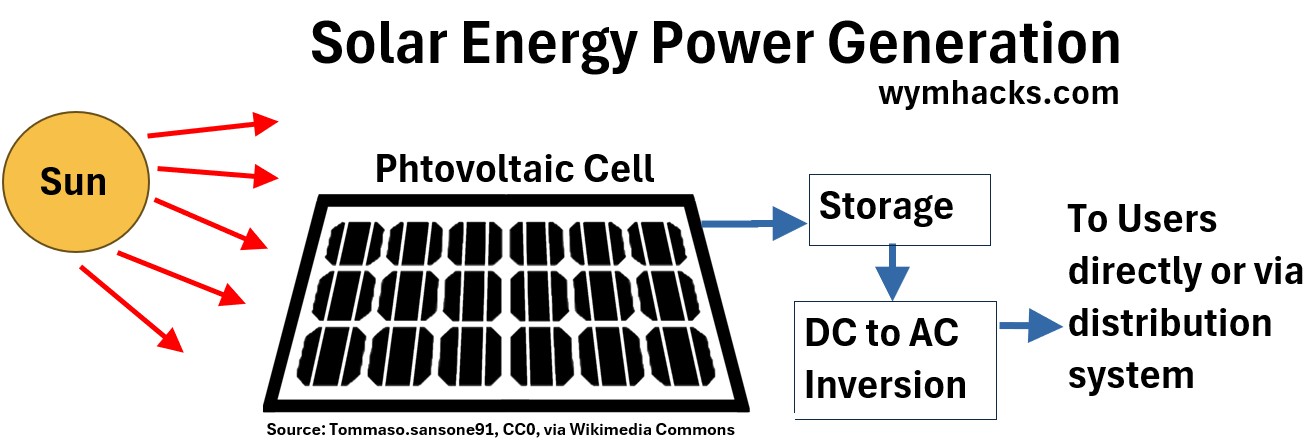
- Photovoltaic (PV) Plants: Use solar panels to convert sunlight directly into electricity.
- See my article: Solar Power Explained: Equipment, Physics, and Manufacture
- Light photons cause the release of electrons from silicon-Boron and silicon-phosphorous semiconductors and
- are captured as DC current.
- The DC is inverted to AC and then routed to end users (immediately or via the electrical grid).
- Concentrated Solar Power (CSP) Plants: Use mirrors to focus sunlight and create high heat to run a steam-based thermal cycle.
- Marine Power Plants:
- Tidal Power: Uses the rise and fall of ocean tides to turn turbines.
- Wave Power: Uses the movement of ocean waves.
Texas, USA, And World Energy Sources for Electricity Generation
In this section we’ll look at the various energy sources used to generate electricity and their relative proportions.
I’ll start with a global breakdown and then we’ll look at Texas and the United States.
World Electricity Production and Source Mix
Picture: World Electricity Mix
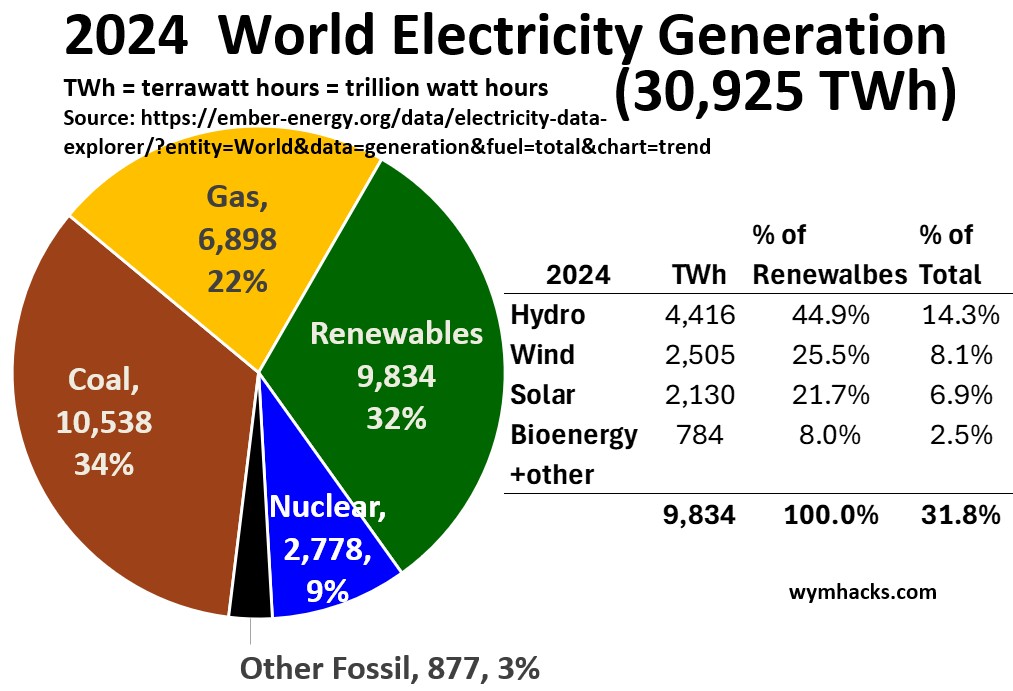
The world’s electricity mix today shows a balance between legacy fossil fuels
- coal
- natural gas
- oil
and renewables
- hydro
- wind
- solar
- bioenergy
- geothermal
Note that nuclear is really in its own category. It is a clean, non-renewable, non-fossil fuel.
Coal and Renewables are locked in a near dead-heat for the largest share globally, driven by
- Asia’s heavy reliance on the former and
- massive deployment of Wind and Solar in the West and China.
While fossil fuels still provide the majority of power (about 59%) the current growth trajectory indicates that clean energy sources will become the dominant generation source in the very near future.
Here are graphs showing the fuel mixes in Texas , the USA, and the World for generating electricity.
Texas Electric Generation Fuel Mix
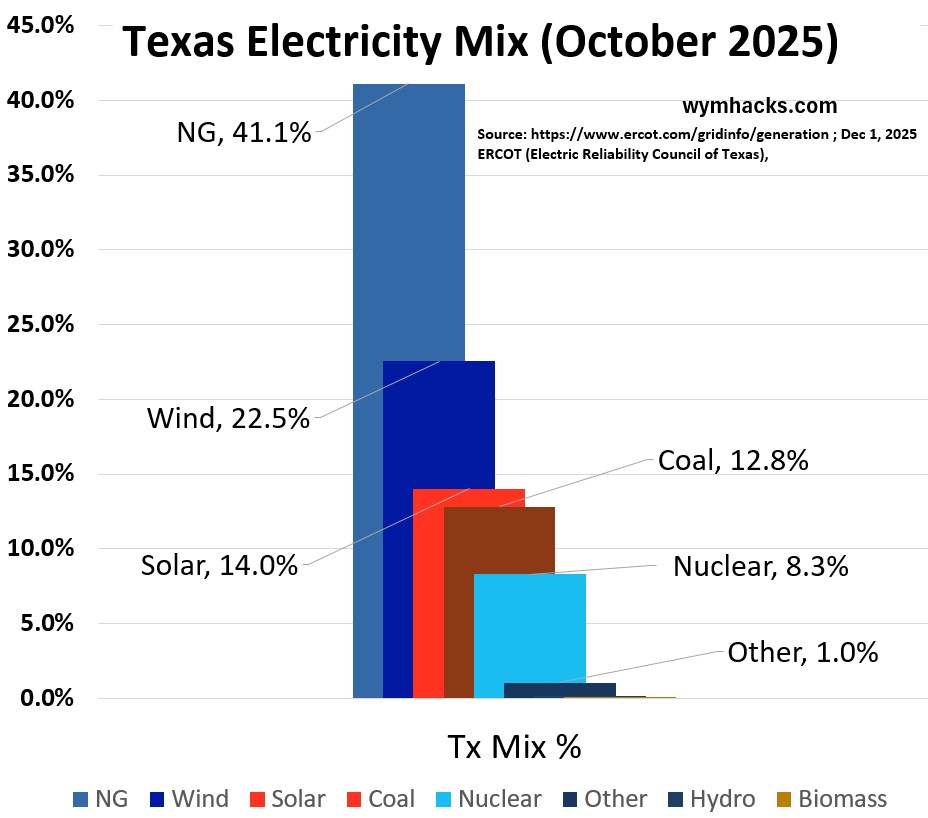
Picture: Texas Electricity Mix (October 2025) – Bar
Picture: Texas Electricity Mix (October 2025) – Pie
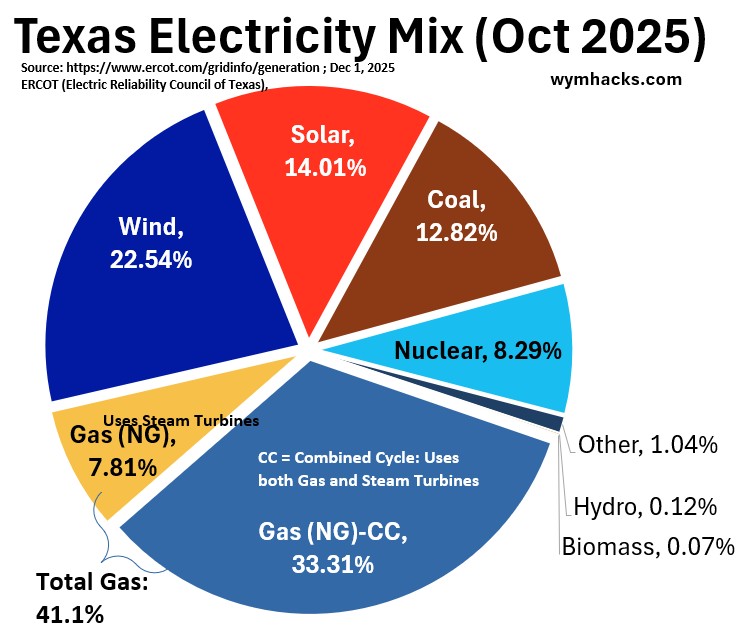
Texas Fuel Mix Observations:
- Natural Gas: The single largest fuel source, providing essential dispatchable (on-demand) power to manage peak demand and back up intermittent renewables.
- Wind: Renewable Leader: Texas is the nation’s leading wind producer.
- Coal & Lignite Declining Baseload: Historically a major source, its share is steadily falling due to retirements and market competition from cheaper gas and renewables.
- Nuclear Stable Baseload: Provides highly reliable, non-variable power 24/7, which is critical for system stability.
- Solar Fastest-Growing: The most rapidly expanding segment, with massive capacity additions that are increasingly noticeable during midday peaks, often displacing natural gas during those hours.
USA Electric Generation Fuel Mix
Picture: USA Electricity Mix
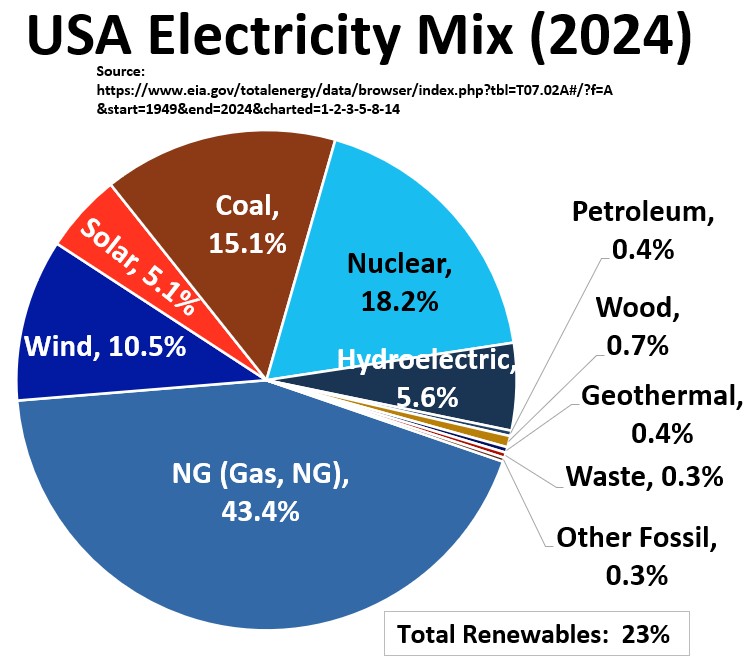
USA Fuel Mix Observations:
- Natural Gas (43.4%) is the largest single source of electricity by a significant margin, making it the primary fuel for the U.S. power grid.
- Low-carbon sources (Nuclear and Renewables) combined account for over 40% of the generation mix.
- Nuclear (18.2%) provides the most stable, non-variable clean energy (baseload power), having a share similar to the largest renewable sources combined.
- Wind (10.5%) is the largest renewable source
- Coal (15.1%) has been significantly displaced by natural gas and renewables but remains a sizable contributor, though its share has declined to a historic low.
- Solar (5.1%) and Hydroelectric (5.6%) are important contributors; solar is notable for being the fastest-growing source, with its generation increasing significantly.
- Marginal Sources: Fuels like Petroleum (0.4%), Geothermal (0.4%), Wood (0.7%), and Waste (0.3%) make up very small portions of the total generation mix.
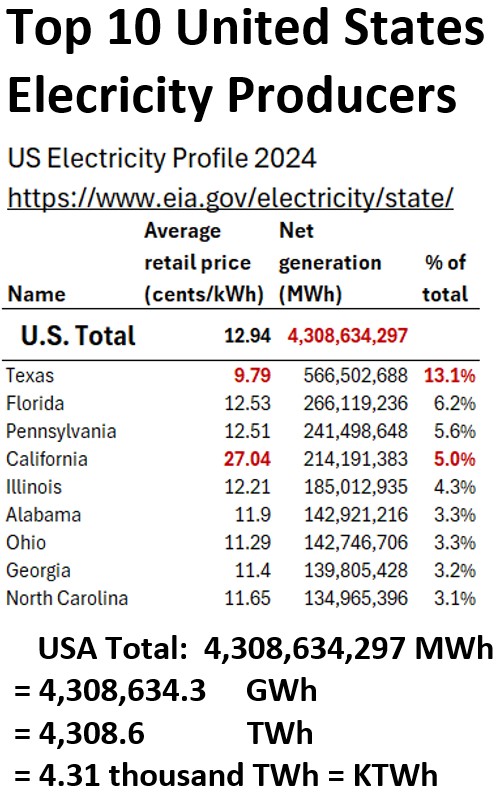
USA Top 10 United States Electricity Producers (2024)
Check out the table below.
- Texas is the big dog. It makes the most power. Prices are the cheapest.
- California is the most populous state (39 million vs Tx’s 31 million…est 2025)
- But its the 4th largest producer
- and has the highest prices.
Picture: Top 10 US Electricity Producers
Lets come back and take a closer look at the Global fuel mix.
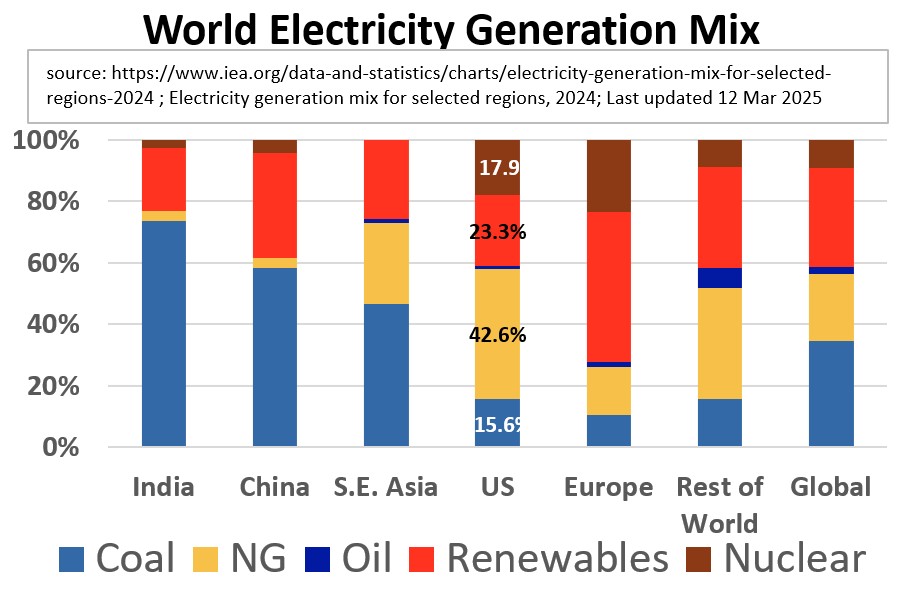
World Electric Generation Fuel Mix
We’ve already seen this one,
Picture: World Electricity Mix
, but lets break down the fuel mix by countries/regions.
Picture: World Electricity Mix – By Country – Stacked
Picture_World Electricity Mix – By Country – Clustered
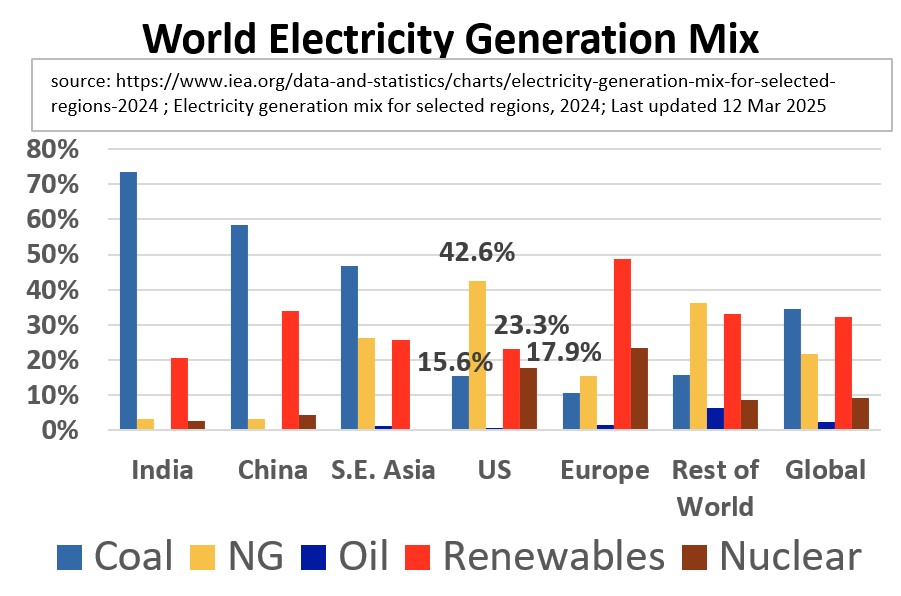
Picture: World Electricity Mix – By Fuel /By Country
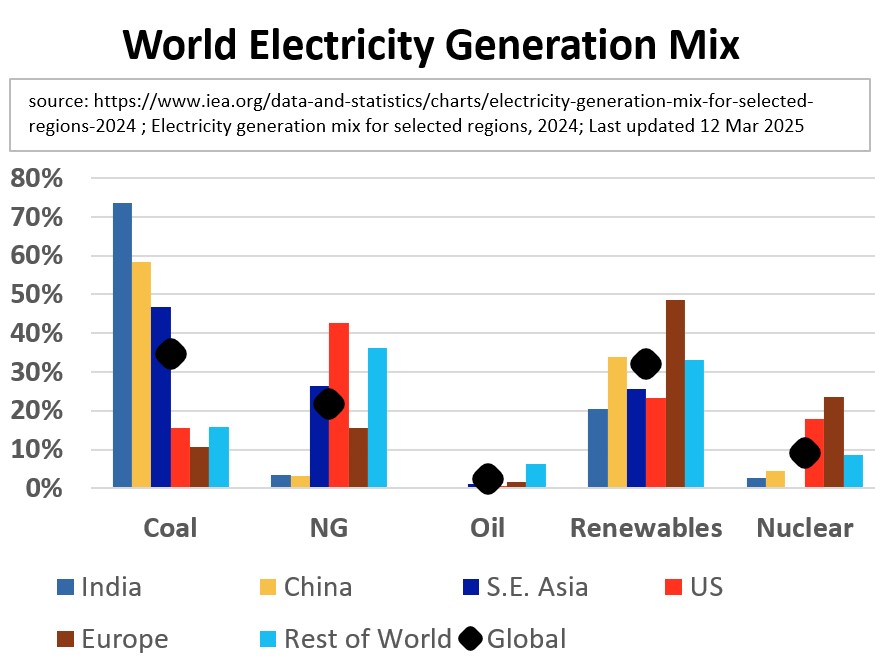
World Fuel Mix Observations
The global fuel mix for electricity generation today is defined by a narrow gap between the two largest sources and a stark geographic divide in fuel choice.
Renewables Challenge Coal’s Lead
- Globally, Coal (34-35%) and Renewables (32-34%) are in a neck-and-neck race for the largest share of electricity generation.
- Recent data shows that the combined output from renewables has, for the first time, surpassed coal in some half-year periods, marking a historic turning point.
Solar is the Engine of Growth:
- Solar power is the fastest-growing source of electricity globally, doubling its generation in roughly the last three years.
- Alongside wind, solar is adding more new electricity generation than all other sources combined.
Fossil Fuels Still Dominate (But Share is Declining):
- Fossil fuels (Coal, Natural Gas, Oil) still account for the majority of the total electricity generated (60%).
- However, their overall share in the mix has been declining as clean electricity growth often meets or exceeds the growth in global electricity demand.
Geographic Divide in Fuel Choice:
- Asia’s Coal Reliance: Developing markets, particularly India and China, maintain an extremely heavy reliance on Coal as the backbone of their rapidly growing industrial economies.
- U.S. Natural Gas Dominance: The U.S. is an outlier among major economies, relying heavily on Natural Gas for its primary source of electricity.
Europe’s Clean Leadership:
- Europe leads the world in the adoption of clean sources, with Renewables (and Nuclear) providing well over half of the region’s total power.
Nuclear Provides Critical Stability:
- Nuclear power (9%) and Hydroelectric (14%) remain crucial sources of stable, low-carbon baseload power, underpinning grid reliability in many advanced economies.
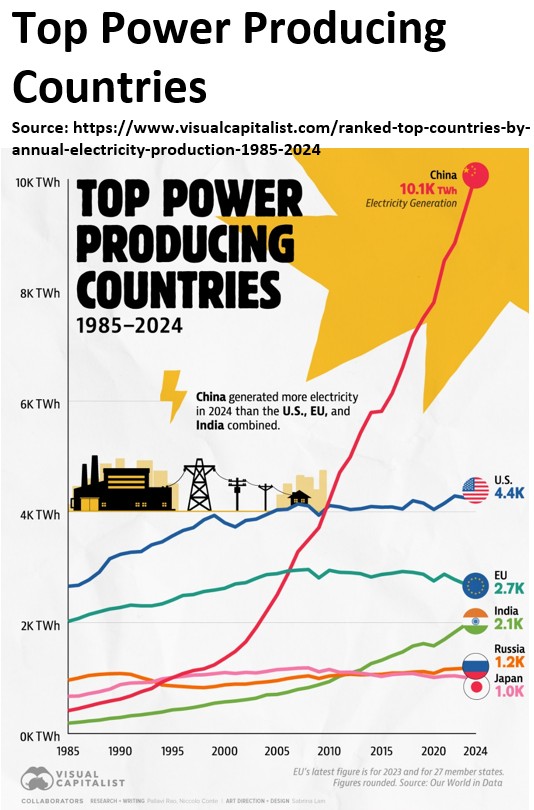
Top Power Producing Countries
Check out the top electricity producers in the world.
China generates a little over 2 times what the USA produces!!
Picture: Top Power Producing Countries (From 1985 to 2024)
Picture: Top Power Producing Countries (2024)
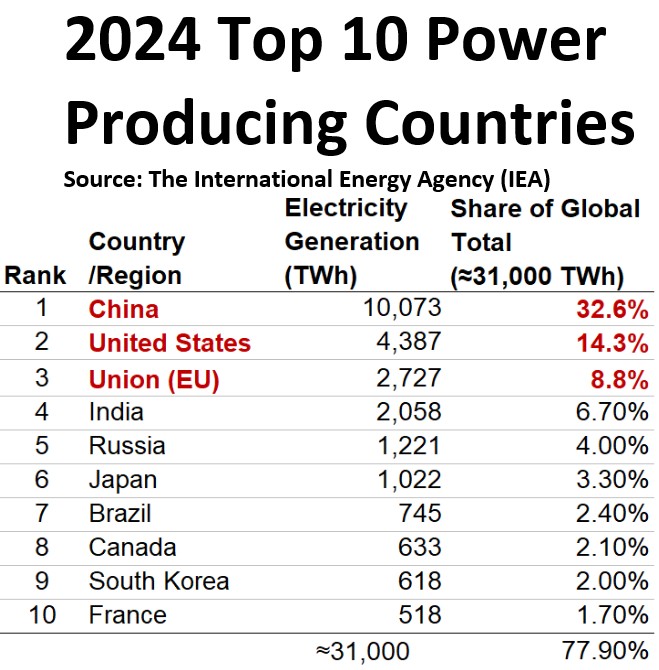
In 2024, the world produced something like 31 thousand trillion Watt hours of electricity.
- 10 countries account for about 78% of the electrical production.
- China in 2024 made more power than the US, EU, and India combined!!
Power Plant Equipment and Configurations
In this section we’ll take a closer look at the power configurations that provide the vast majority of power in the world.
Before we do that let’s learn about some of the key equipment.
Electric Power Generator
The workhorse of all the configurations described below is the power generator.
Picture Electrical Power Generator
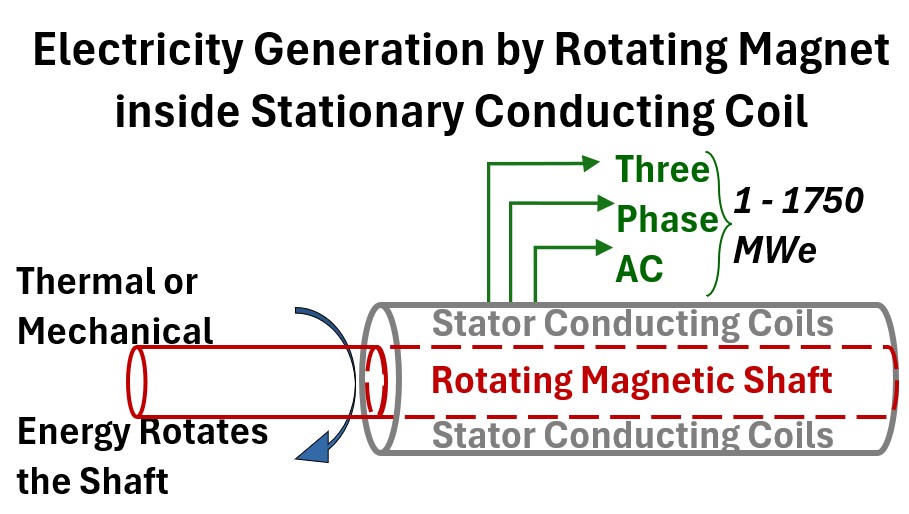
An electric power generator converts mechanical energy (motion) into electrical energy through a principle called electromagnetic induction (Faraday’s Law).
A mechanical input from a prime mover (like a turbine) spins the magnetic shaft (rotor) inside the stationary coil assembly (stator).
As the magnetic field sweeps across the copper wire coils in the stator, this relative motion
- causes the magnetic flux to continuously change, which
- induces a voltage and
- forces electrons to flow in the coils, thereby creating an Alternating Current (AC) electricity output.
The faster the magnetic rotor turns, the greater the rate of magnetic flux change, and the more electricity is generated.
Steam Turbine
A steam turbine operates by directing high-pressure, high-temperature steam through a series of stationary and rotating blades.
Picture: Steam Turbine
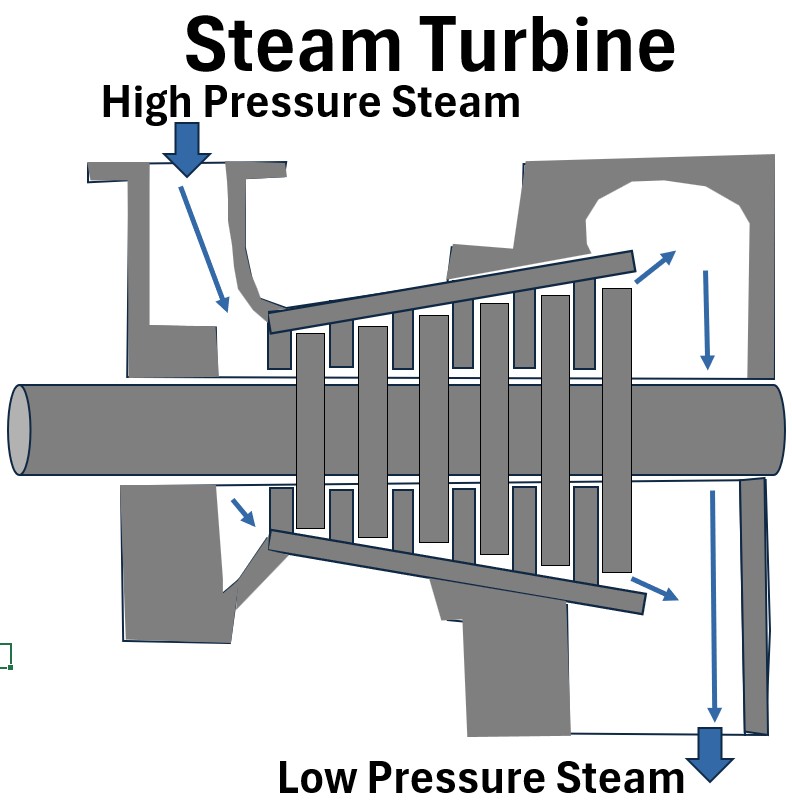
First, the steam passes through stationary nozzles or vanes, where its thermal and pressure energy is converted into kinetic energy, resulting in a high-velocity jet.
This high-velocity steam jet then impacts the rotating blades attached to the central shaft (rotor).
The force exerted by the steam changes its momentum, which in turn causes the wheels and the shaft to spin, converting the steam’s kinetic energy directly into rotational mechanical energy.
This rotational motion is then typically used to drive an electric generator (in the chemical process industries it often drives pumps as well).
The process is repeated across multiple stages, allowing the steam to expand fully and extract the maximum amount of usable energy.
Gas Turbine
A gas turbine converts the chemical energy in fuel into rotational mechanical energy via a high-velocity gas stream.
Picture : Gas Turbine
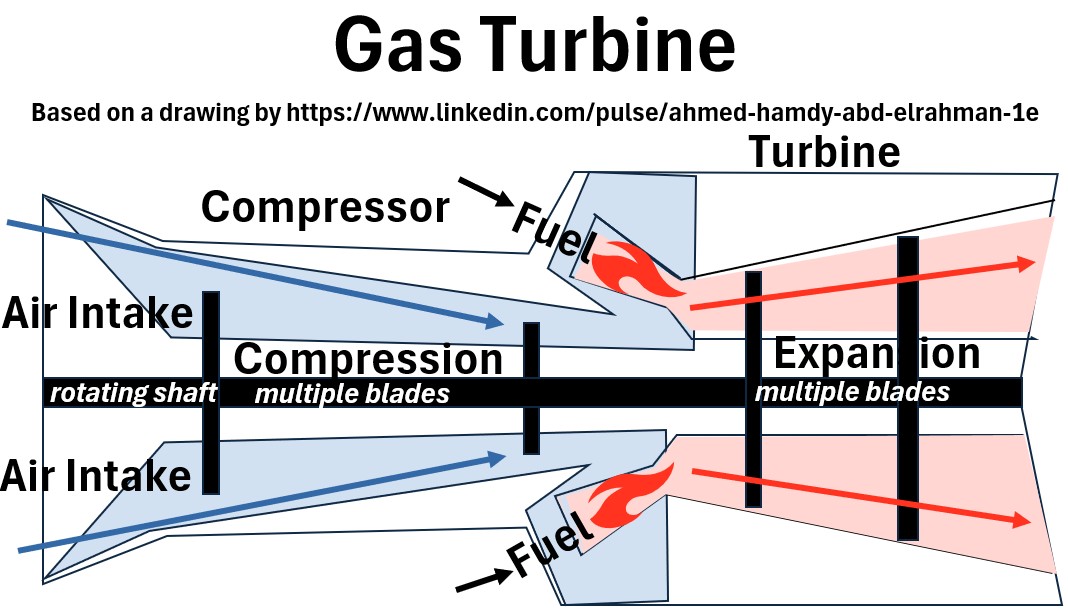
In the compression section, a series of rotating blades rapidly pressurizes the incoming air, increasing its energy potential.
This high-pressure air then enters the combustion section, where fuel is continuously injected and burned, creating extremely hot, high-pressure gas.
Finally, in the expander section (the turbine), this hot gas expands and pushes against the rotor blades, spinning the central shaft to generate work.
The work generated by the turbine drives the compressor to sustain the process, with the remaining energy outputted to drive a generator or other machinery.
Typically, 50% to 70% of the power produced by the expander (turbine) section is directly consumed to drive the compressor, as both components are mounted on the same central shaft.
Only the remaining 30% to 50% of the turbine’s output energy is considered the net work output available to drive external equipment.
The remaining mechanical energy (the net output) is used to drive
- Electric Generators: In power plants, the main shaft is coupled to an electric generator to produce electricity, which is the most common application.
- Mechanical Drives: In industrial or marine settings, the shaft drives equipment such as pipeline compressors (for moving natural gas), large pumps (for oil or water), or ship propellers.
- Aircraft Propulsion: In jet engines, the net work primarily drives a large fan (in a turbofan) or is converted to thrust by accelerating the exhaust gases.
Water Tube Steam Boiler
Water tube boilers are most commonly found in large-scale industrial and utility applications where the demand is for high volumes of high-pressure, high-temperature steam.
Picture: Water Tube Steam Boiler
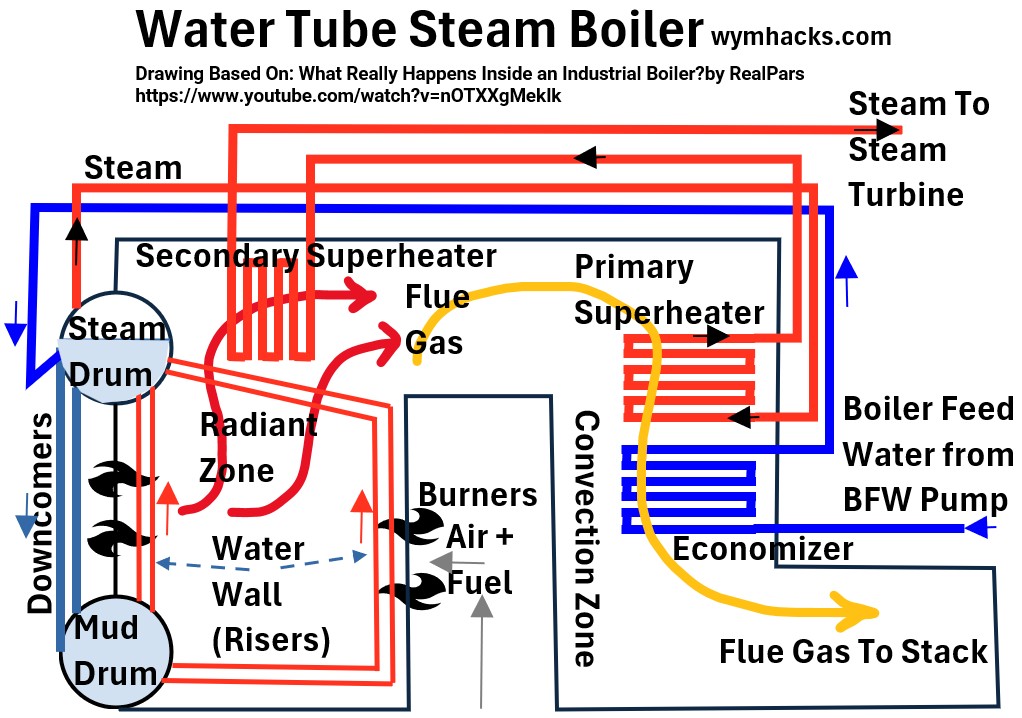
This water tube boiler system efficiently converts fuel energy into superheated steam through the following process.
- The process begins with Boiler Feedwater (BFW) entering the Economizer in the Convective Zone,
- where it is pre-heated using residual heat from the departing flue gas to boost efficiency.
- The warmed water then flows to the large overhead Steam Drum, which acts as a reservoir and separator.
- From the drum,
- Downcomers carry the dense, cooler water to
- the bottom Mud Drum, which distributes it into
- the Water Wall Tubes lining the furnace.
- These tubes, also called risers, absorb intense radiant heat from the flame created by the Wall Burners in the Radiant Zone,
- causing the water to flash into a steam-water mixture that rises back to the Steam Drum for separation.
- The resulting dry steam then sequentially passes through the Primary and Secondary Superheaters (located in both convective and radiant zones)
- to increase its temperature and energy content, producing Superheated Steam.
- This high-energy steam is finally routed to the Steam Turbine to generate power, while the cooled Flue Gas exits the system via the Stack.
Heat Recovery Steam Generator (HRSG)
These are cousins of the traditional fired water tube boiler.
Heat Recovery Steam Generators (HRSGs) are employed primarily to maximize energy efficiency by converting waste heat into useful steam.
They are employed any time there is a reliable, high-volume source of hot waste gas that can be utilized to produce steam, dramatically reducing fuel consumption and operational costs.
They are typically employed in two main scenarios:
- Combined Cycle Power Plants (CCPP) – Described in a later section
- This is the most common and significant application.
- Industrial Cogeneration (CHP)
- HRSGs are also widely used in industrial facilities, known as Cogeneration or Combined Heat and Power (CHP) plants.
Picture: HRSG
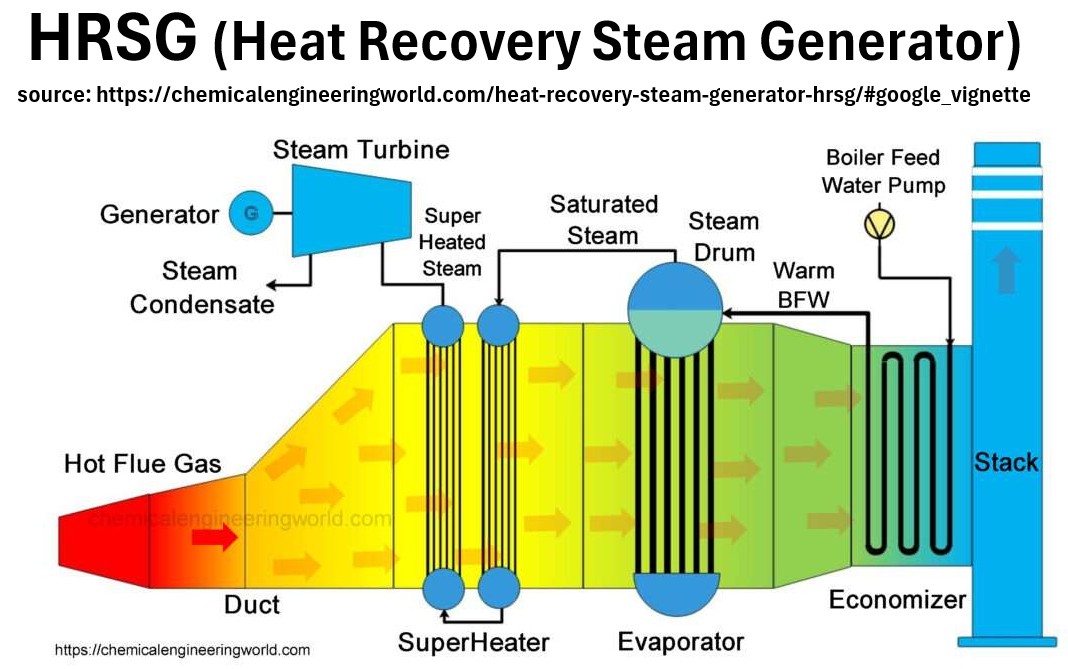
Hot Exhaust (Gas Turbine Input)
- The process begins with the Hot Exhaust Gas entering from the gas turbine.
- This gas, typically entering at 500 C to 650 C (approx. 930 F to 1200 F), carries the heat energy that the HRSG is designed to recover.
- The exhaust gas flows sequentially through the heating sections, transferring its heat to the water and steam.
Superheater
- The Superheater is the first section the hot gas encounters.
- It is strategically placed here because it requires the highest temperature gas to function.
- It takes saturated steam from the steam drum and heats it well above the boiling point to produce Superheated Steam, which is crucial for maximizing steam turbine efficiency and preventing blade erosion.
Evaporator
- The Evaporator section (also known as the boiler bank) is where the bulk of the phase change occurs.
- Water circulated from the steam drum flows through these tubes, absorbing heat from the gas and converting the water into a mixture of saturated water and steam,
- which is then routed back up to the drum for separation.
Economizer
- The Economizer is the last major heat recovery section.
- It receives cool feedwater before it enters the evaporator section.
- Its purpose is to pre-heat the water using the relatively cooler exhaust gas, thus raising the water temperature closer to the boiling point and recovering heat that would otherwise be wasted up the stack, significantly improving the overall thermal efficiency.
Stack
- The Stack is the final exit point for the exhaust gas.
- After passing through all the heat recovery sections, the gas has been cooled considerably and is safely dispersed into the atmosphere.
Steam Drum
- The Steam Drum sits atop the HRSG and serves as the central separation point and reservoir.
- It separates the saturated steam from the water/steam mixture returning from the evaporator tubes and stores the feedwater necessary to supply the economizer and downcomers, thereby maintaining the boiler’s circulation loop.
Superheated Steam to Turbine
- The Superheated Steam leaving the superheater is a high-energy, high-velocity gas.
- It is directed into the Steam Turbine, where its thermal energy and pressure are efficiently converted into rotational kinetic energy,
- which is used to drive an electrical generator.
Ok, let’s take a look at some power plant configurations now.
Configuration: Steam-From-Boiler Power Generation
The Steam-From-Boiler Power Generation schematic below depicts a foundational Rankine cycle configuration.
Picture: Steam-From-Boiler Power Generation
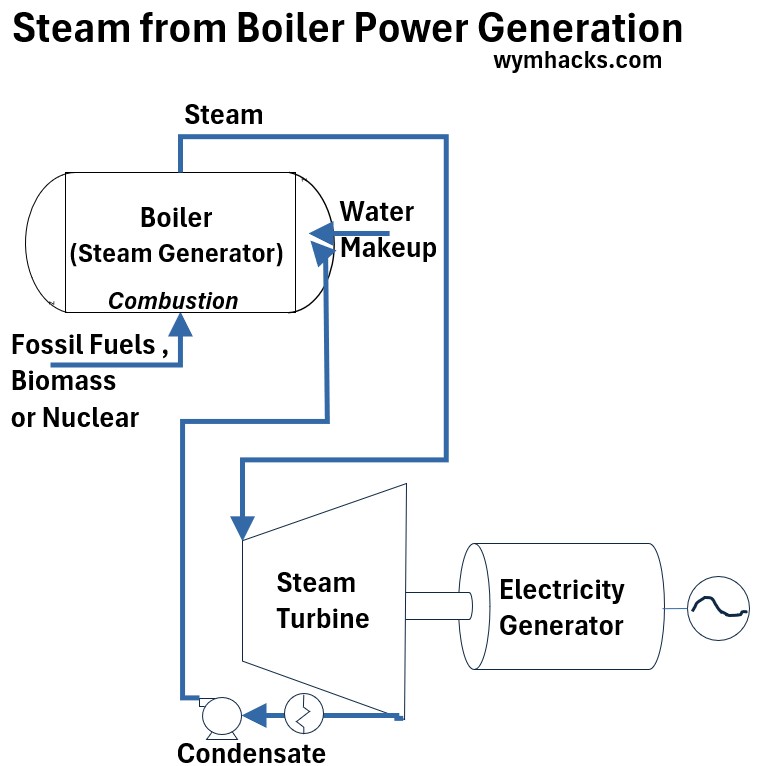
The four main components of this configuration are:
- the boiler (or steam generator) where fuel combustion (or heat from nuclear fission) heats water into superheated steam;
- the turbine, where the steam’s thermal energy is converted into rotational mechanical energy;
- the generator, which converts mechanical energy into electricity; and the
- condenser, where spent steam is cooled back into water (condensate).
- The water is then pumped back to the boiler by the feed pump, completing the closed-loop cycle.
This configuration represents the vast majority of thermal power plants globally.
This includes nearly 100% of coal-fired, natural gas combined-cycle (where the boiler is replaced by a Heat Recovery Steam Generator or HRSG), oil, and nuclear power plants.
Due to the high global reliance on coal, gas, and nuclear, this basic steam cycle is present in well over 50% of total worldwide electricity generation capacity.
The efficiency hinges upon maximizing the steam temperature and pressure and achieving the lowest possible condenser pressure.
As I noted above, the heat needed to boil water into steam will come from fossil fuels or nuclear fission.
Yep, you guessed it, we might as well learn a little about combustion and nuclear fission.
Combustion
Fossil fuel combustion is a chemical reaction—specifically, the rapid oxidation (burning) of ancient carbon and hydrogen compounds found in coal, oil, and natural gas.
This process is highly exothermic, meaning it breaks the stored chemical bonds and releases large amounts of energy primarily as heat.
In a power plant, this heat is captured to create high-pressure steam that drives a turbine and generator.
The primary and most consequential byproducts of this reaction are carbon dioxide CO2 and water vapor H2O, with the release of CO2 being the single largest contributor to human-caused climate change.
Picture: Fossil Fuel Combustion (Burning)
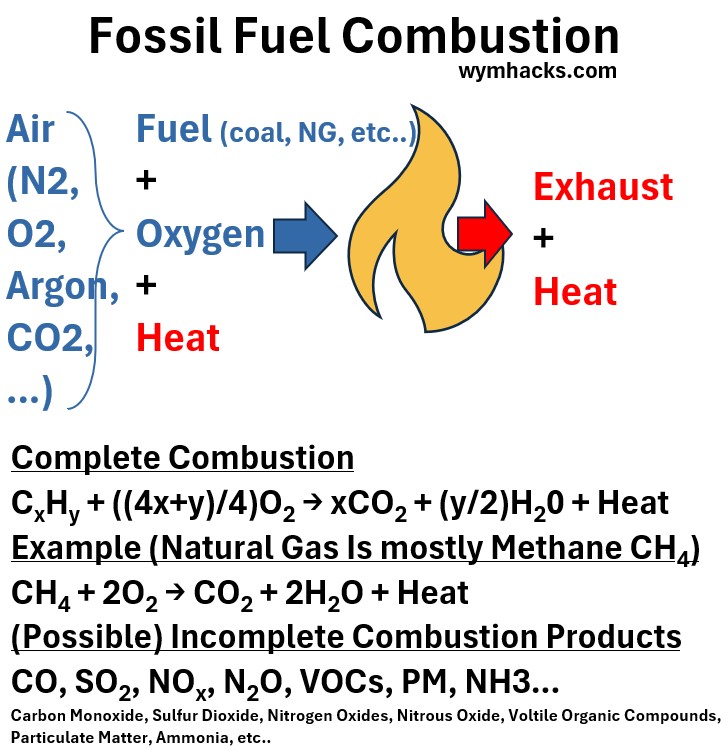
Combustion is typically not complete and can produce
- CO – Carbon Monoxide
- SO2 – Sulfur Dioxide,
- Nitrogen Oxides – NOx , N2O
- Volatile Organic Carbons VOCs,
- Particular Matter PM,
- Ammonia NH3
- etc..
so various technologies must be employed to reduce / eliminate these undesired by products (like low NOx burners, filters, cyclones, capture beds, etc.)
Nuclear Fission
Nuclear fission is the process where a neutron
- collides with a heavy atom, typically uranium-235,
- causing it to split into two smaller atoms,
- which in turn releases kinetic energy and several new neutrons.
This liberated energy manifests as intense heat within a reactor core, driving a controlled chain reaction.
Picture: Heat from Nuclear Fission
Configuration: Nuclear Power Plant
Nuclear power plants operate on the same basic principle as conventional thermal plants: heat is used to boil water, creating steam that spins a turbine to generate electricity.
The fundamental difference lies in the heat source:
- while conventional plants (like coal or natural gas) generate heat through the chemical process of combustion (burning fuel),
- nuclear plants generate heat through the physical process of nuclear fission, where the controlled splitting of uranium atoms releases immense amounts of energy.
- This unique process allows nuclear plants to operate for years without refueling and,
- crucially, produces virtually no greenhouse gas emissions or air pollutants during operation, unlike the fossil fuel combustion used in conventional power plants.
In a nuclear power plant, nuclear heat is continuously absorbed by a coolant (usually water) circulating through the core.
Boiling Water Reactor (BWR) water is allowed to boil directly into steam.
In the more common Pressurized Water Reactors (PWRs),
- the superheated water transfers its heat to a separate, lower-pressure water loop via a steam generator,
- causing that secondary water to flash into the high-pressure steam required to spin a turbine and generate electricity.
Picture: Nuclear Power Plant Steam Generation Configurations
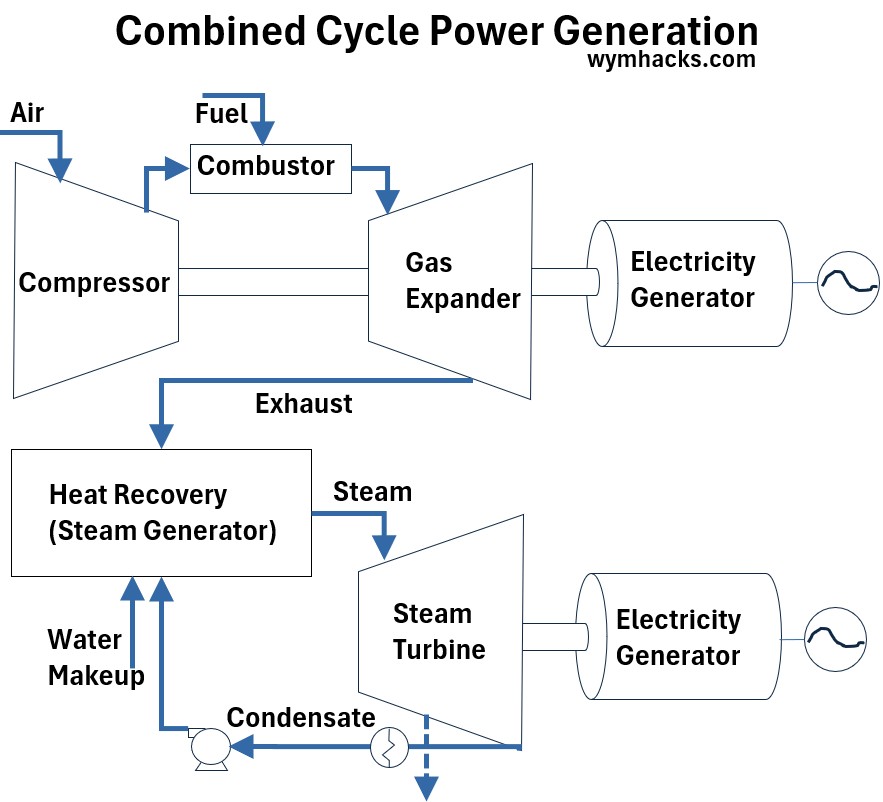
Configuration: Combined Cycle Power Plant
A Combined Cycle Power Plant (CCPP) uses two thermodynamic cycles in tandem to maximize efficiency.
First, natural gas is burned to power a gas turbine (Brayton cycle) and generate an initial amount of electricity.
Second, the incredibly hot exhaust gas from the gas turbine is captured in a Heat Recovery Steam Generator (HRSG) to boil water and produce high-pressure steam.
This steam then drives a steam turbine (Rankine cycle) to generate a significant amount of additional electricity without burning any extra fuel.
These plants are very frequently used in the modern energy industry, particularly in regions with affordable natural gas.
They are the most efficient form of fossil fuel generation, achieving efficiencies over 60%
In the United States, for example, combined-cycle systems account for over half of all natural gas-fired electric generating capacity, providing a large and flexible source of base and intermediate load power.
Picture: Combined Cycle Power
Below is a very cool 3D model of a combined cycle Power plant. I think it’ll be fun to describe the process so let’s go.
Picture: Example 3D Model of Combined Cycle Power Plant
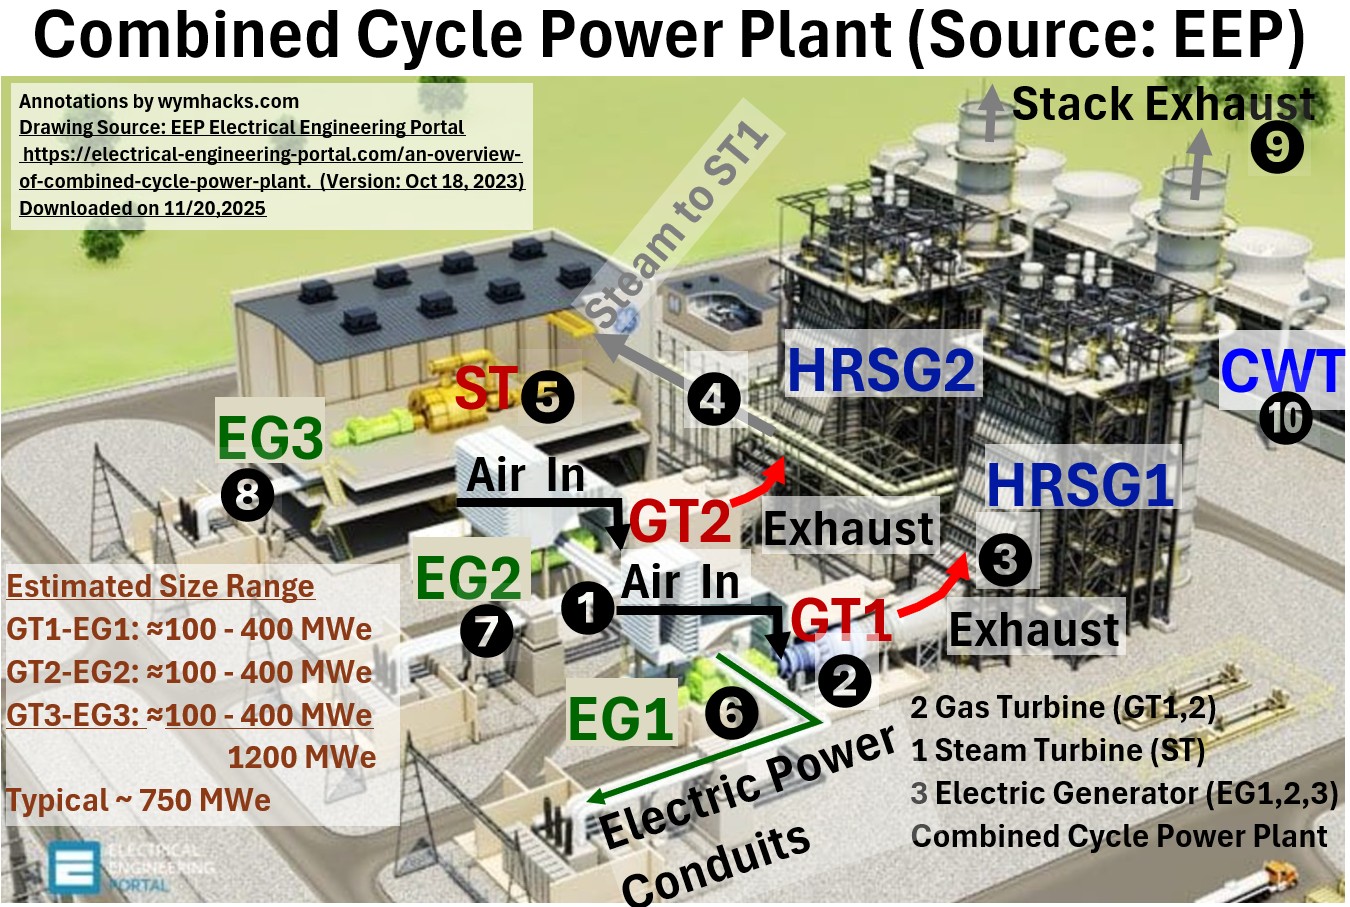
This is a common 2 x 1 Combined Cycle configuration, meaning two gas turbines feeding one steam turbine—a very common high-efficiency setup.
1 Air Intakes:
These components draw ambient air into the gas turbine compressor section. The quality and temperature of this air are crucial, as the compressor must rapidly pressurize the air before it is mixed with fuel in the combustor, starting the Brayton cycle.
2 Gas Turbines (GT):
These units compress the air, mix it with fuel (usually natural gas), ignite it, and use the resulting high-pressure, hot expanding gases to spin the turbine blades.
This rotation drives the GT’s own generator to produce the bulk of the plant’s electricity.
3 GT Exhaust to HRSG:
This piping channels the extremely hot exhaust gases (often over 600 C) from the gas turbine directly into the Heat Recovery Steam Generator (HRSG).
This is the critical heat-exchange link that transfers the waste heat from the GT’s Brayton cycle to the HRSG’s Rankine steam cycle.
4 Steam Piping to Steam Turbine from HRSG:
This high-pressure piping carries the superheated steam, which was generated in the two HRSG units, to the inlet of the single steam turbine.
The steam must be maintained at peak pressure and temperature to maximize the turbine’s efficiency.
5 Steam Turbine with Generator:
This component accepts the steam from the two HRSGs and converts the steam’s thermal energy into rotational mechanical energy by expanding the steam across multiple blade stages.
This rotation drives a separate generator, producing the secondary source of electricity in the plant.
6, 7, 8 Power Conduit from Gas Turbine:
The three conduits from each of the power generators carry the AC electricity to the plant’s main switchyard or transmission system, often after passing through a step-up transformer to raise the voltage.
Configuration: Cogeneration Plant – Combined Heat and Power (CHP)
A Combined Heat and Power (CHP) plant, also known as cogeneration, simultaneously generates both electricity and useful thermal energy (heat) from a single fuel source, achieving dramatically higher overall fuel efficiency (typically 65% to 85%).
Picture: Cogeneration Plant (CHP) – Combined Heat and Power
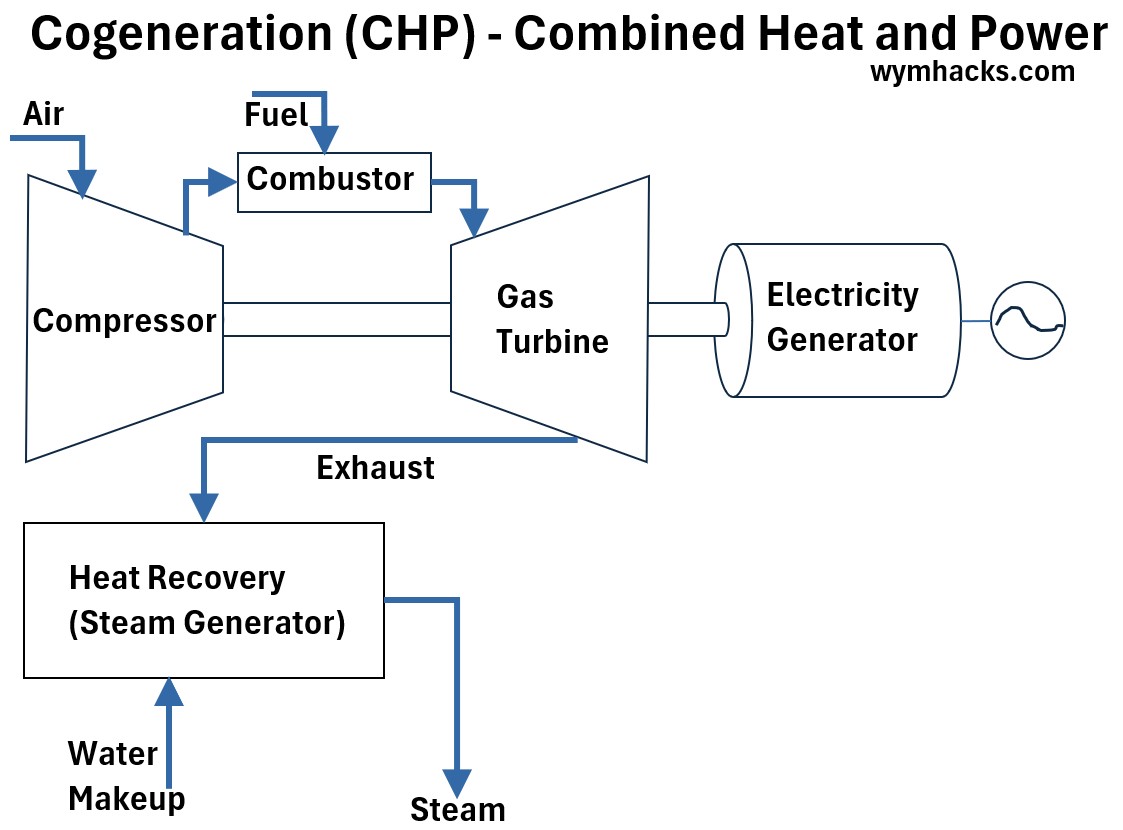
The system uses a prime mover, like a gas turbine or reciprocating engine, to generate electricity.
Instead of venting the waste heat, a heat recovery unit captures it to produce steam or hot water for industrial processes, district heating, or cooling.
CHP is widely and frequently used in industry, institutions, and large commercial facilities because of its efficiency and reliability.
Globally, CHP accounts for around 9% of total power generation, but its penetration is much higher in certain sectors; over 85% of generating capacity at energy-intensive industrial and commercial facilities in some countries (like the U.S.) utilizes CHP technology, particularly in chemicals, paper, and refining.
Configuration: Wind Power Plants
A wind power farm converts the kinetic energy of the wind into usable electricity through several key steps.
Picture: Wind Power
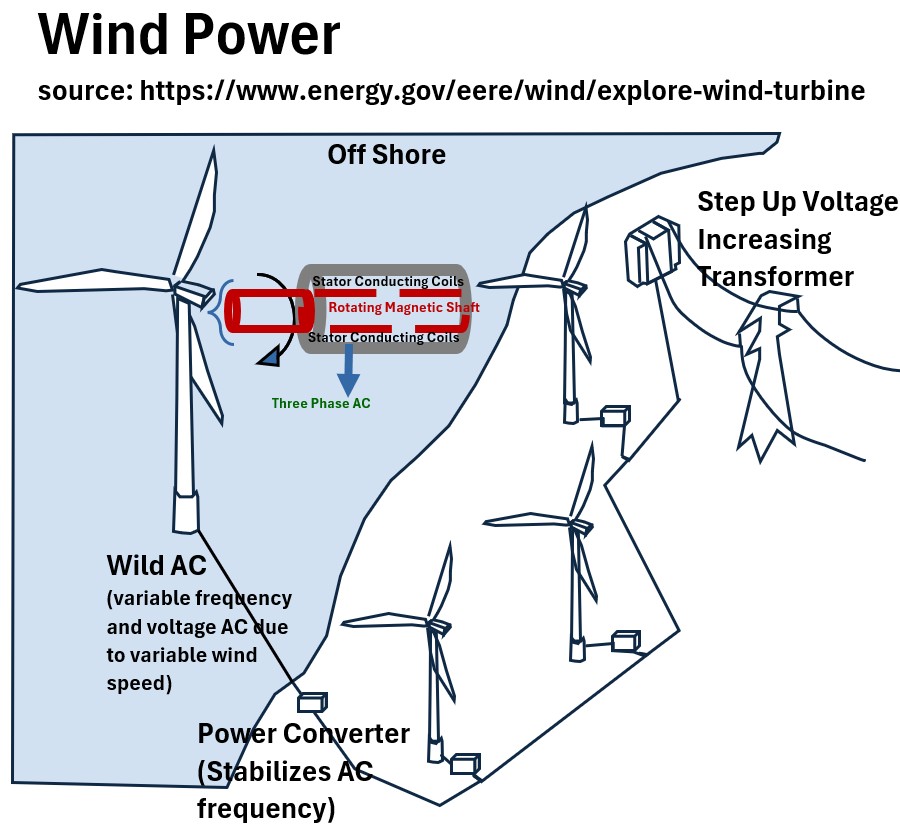
- The turbine blades capture the wind and turn a central shaft, which drives a generator located within the nacelle (or in some modern designs, located directly at the hub or even distributed along the blade).
- This initial power output is typically wild Alternating Current (AC), meaning its frequency and voltage fluctuate with the changing wind speed.
- This fluctuating power is routed through a power converter at the base of the turbine (or nearby) to stabilize the signal, creating consistent, high-quality AC power.
- The stable power from multiple turbines is then collected and routed to a step-up transformer .
- This substation dramatically increases the voltage for efficient, long-distance transmission over power lines to the electrical grid, minimizing energy loss.
- The entire assembly, whether deployed on land (onshore) or in the ocean (offshore), operates as a coordinated system to ensure reliable and continuous delivery of electricity.
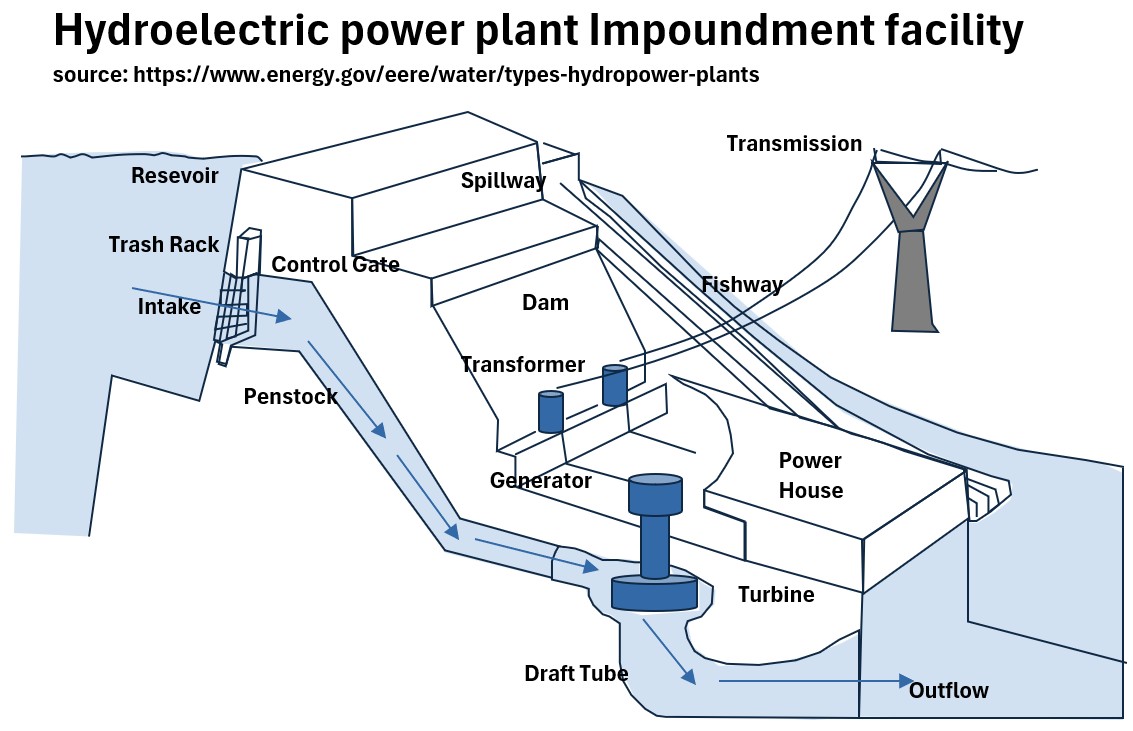
Configuration: Hydroelectric Power Plants
The most common type of hydropower plant is Impoundment Hydropower, which uses a dam to create a large reservoir.
Impoundment plants account for the vast majority of installed hydroelectric capacity globally.
Their ability to store water and release it “on demand” makes them highly valuable for controlling flow and providing reliable, dispatchable power.
Their operation is fundamentally straight forward:
- A large dam is used to create a reservoir .
- Water is stored and released on demand through a penstock to spin a turbine.
- This is used to generate electricity which is stepped up in voltage and routed to the electrical grid.
Picture: Impoundment Facility Hydroelectric Plant
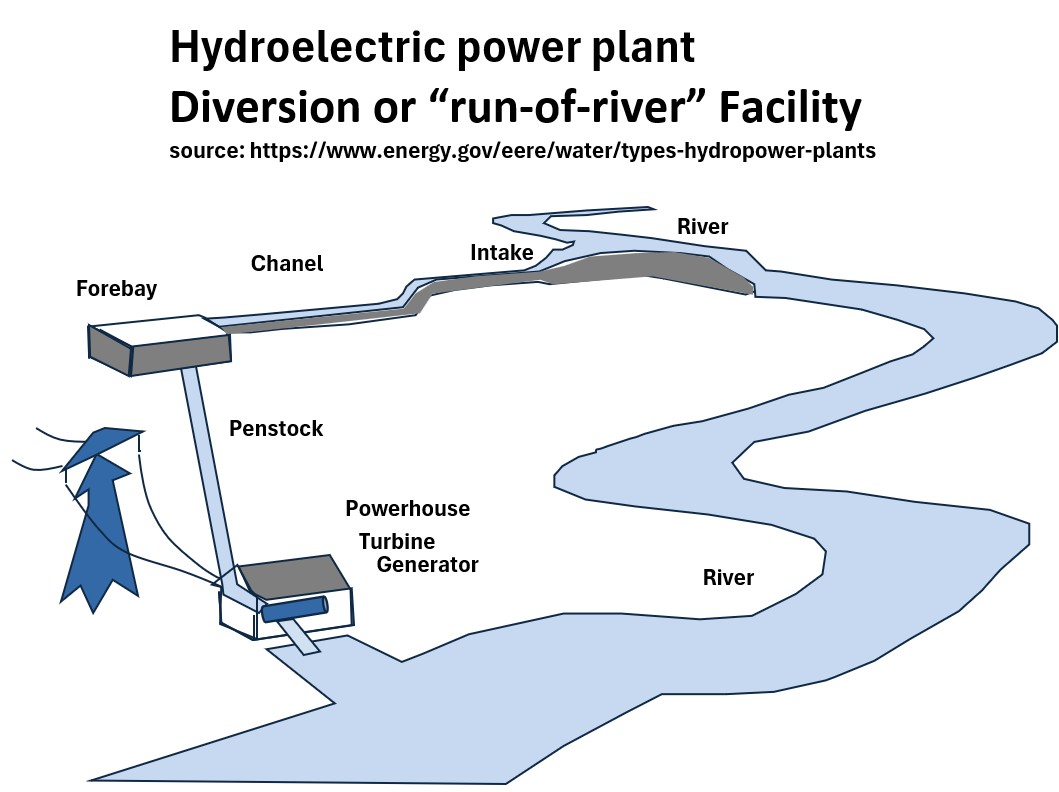
Run-of-River hydropower diverts a portion of a river’s flow through a canal or pipe to a powerhouse, utilizing the natural drop and current of the stream rather than a large reservoir.
Picture: Run of River Hydroelectric Plant
Pumped Storage Hydropower (PSH), uses excess, cheap off-peak electricity to pump water from a lower reservoir to an upper one, and then releases that water through a turbine to generate power when demand and prices are high.
Consider the configuration presented in the picture below, where a solar farm provides energy to a city.
Picture: Pumped Storage Hydropower (PSH)
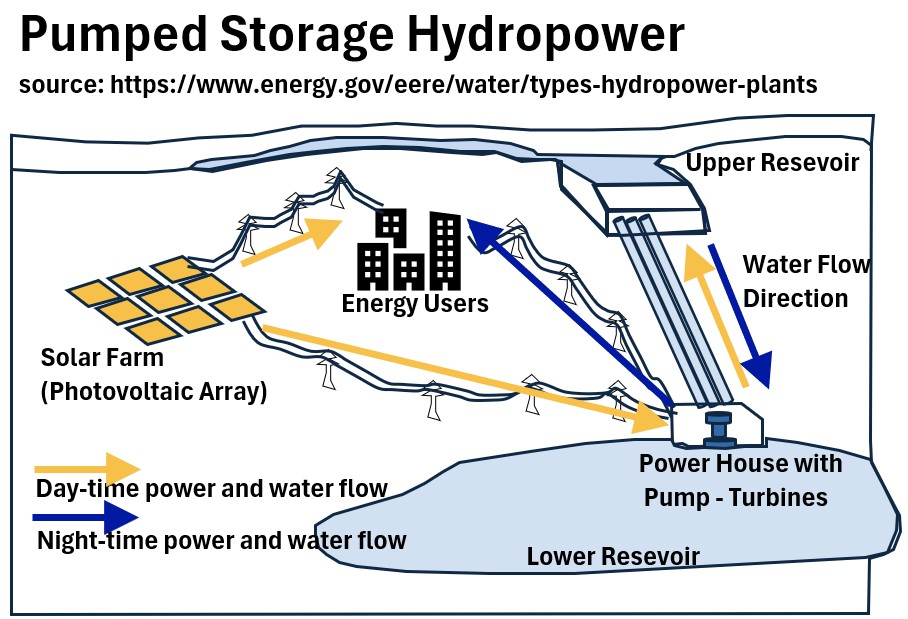
Here is how the PSH system with the solar farm would work:
Charging (Solar Peak/Low Demand):
- During the day, the Solar Farm generates electricity at its peak output (typically midday).
- When the city’s power demand is lower than the solar farm’s output (or when power prices are low), the excess electricity is directed to the Pump-Generator unit at the Lower Reservoir.
- The Pump-Generator acts as a pump, drawing water from the Lower Reservoir and pushing it uphill to the High Reservoir.
- This process stores energy in the form of gravitational potential energy .
Discharging (Solar Trough/High Demand):
- When the sun sets (solar trough) or when the city’s electricity demand is very high (peak evening hours), the process reverses.
- Water is released from the High Reservoir and flows downhill through the penstock back to the Lower Reservoir.
- The Pump-Generator unit acts as a turbine-generator, spinning as the water flows through it, converting the gravitational potential energy back into electricity.
- This power is then fed directly back to the city via the power lines, supplying clean, dispatchable power when it is needed most, effectively covering the solar farm’s evening drop-off.
In essence, the PSH facility allows the solar farm to provide continuous, 24-hour service to the city by time-shifting the energy produced during the day to be used at night.
Configuration: Geothermal Electric Power Generation
Dry Steam Geothermal Power Plant
This is the simplest and oldest type of geothermal power plant.
Picture: Geothermal Dry Steam Power Plant 

- It utilizes reservoirs that produce extremely hot, pure steam with very little water mixed in.
- The Dry Steam is piped directly from the ground well to the steam turbine, which spins a generator.
- Once the steam passes through the turbine, it is condensed and often reinjected into the ground.
- This process uses pure steam directly; no need for a boiler or external pump/heat exchanger.
Flash Steam Geothermal Power Plant
This is the most common type of geothermal plant today.
Picture: Geothermal Flash Steam Power Plant
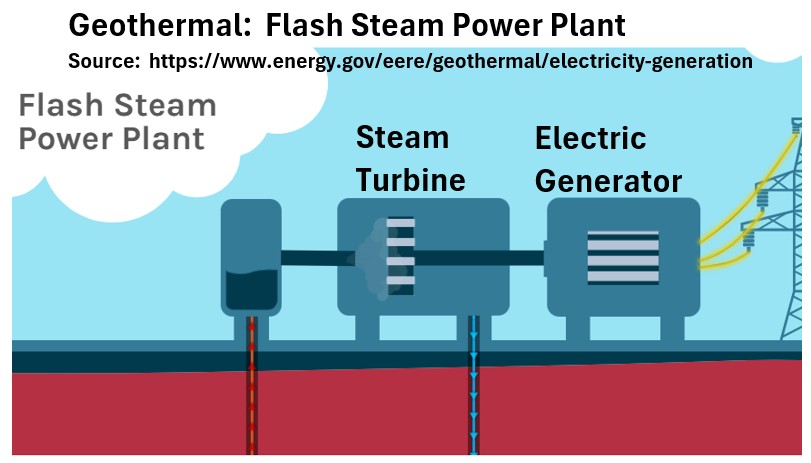
- It uses hot water reservoirs that are under immense pressure (hydrothermal fluids).
- When the pressurized hot water is brought to the surface, the pressure is drastically reduced (flashed) in a separator or flash tank.
- This sudden drop in pressure causes a small amount of the superheated water to rapidly vaporize into Flash Steam , which is then used to drive the turbine.
- The process Converts high-pressure hot water into steam through depressurization.
Binary Cycle Geothermal Power Plant
This is the newest and fastest-growing type, preferred for lower-temperature geothermal resources.
Picture: Geothermal Binary Cycle Power Plant
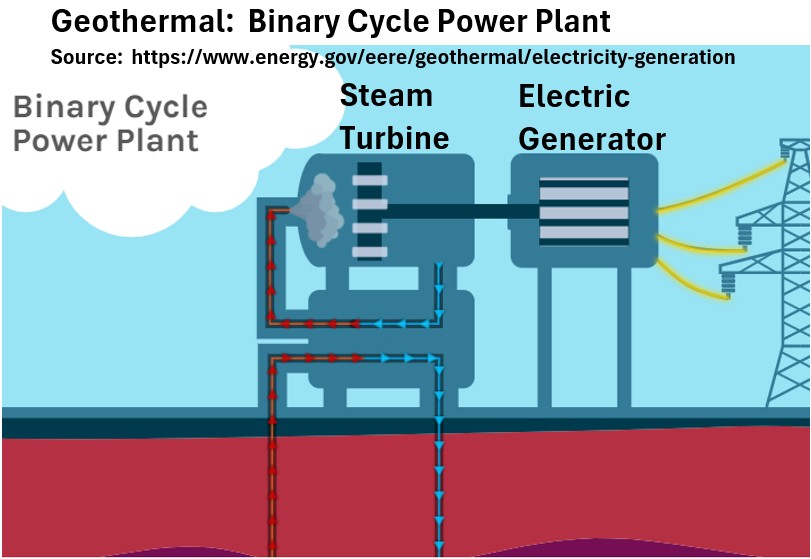
- In a Binary Cycle plant , the hot geothermal water never touches the turbine.
- Instead, it is passed through a heat exchanger where its thermal energy is transferred to
- a second, separate working fluid (the “binary” fluid) that has a much lower boiling point than water (e.g., isopentane or isobutane).
- This working fluid vaporizes rapidly, and its resulting high-pressure vapor drives the turbine.
- In this process, the geothermal water is never exposed to the atmosphere,
- and the separated working fluid is used to drive the turbine.
- This allows for lower operating temperatures and minimizes emissions.
Energy Conversion Efficiencies
How efficient do you think a steam turbine is? You might be surprised.
Remember that we define efficiency as Energy Converted to Useful Work/Total Energy Consumed.
Check out the graph below for common energy conversion efficiencies.
Graph: Energy Conversion Efficiencies for Various Technologies
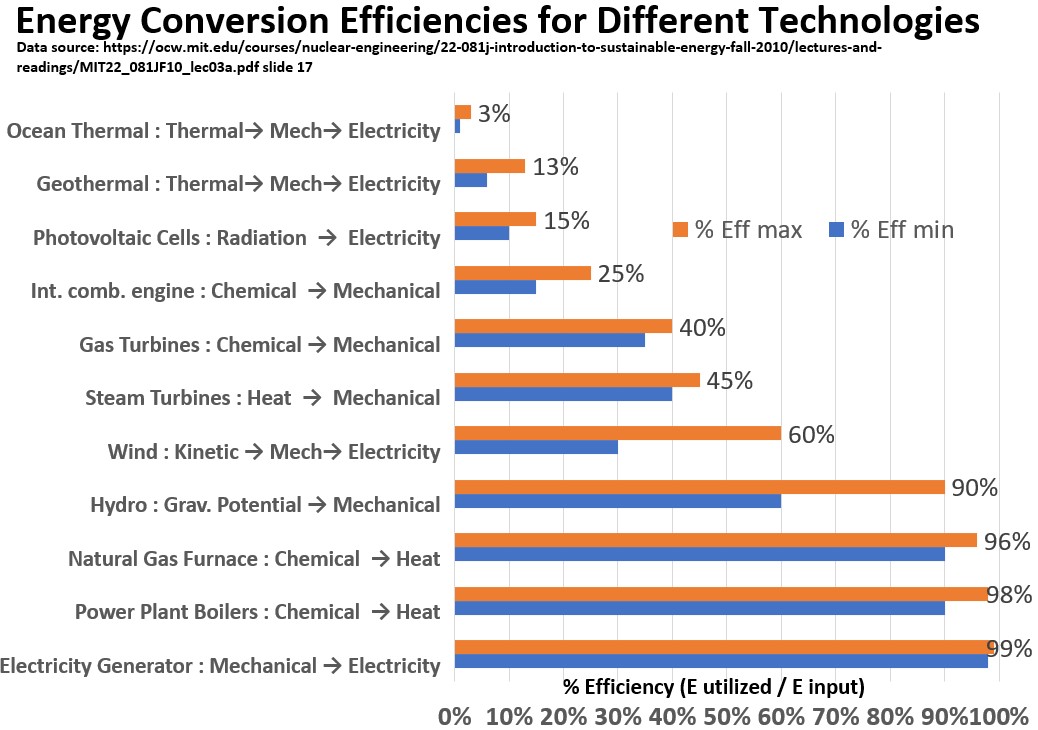
Observations based on the Graph Above:
- The energy-conversion-to-useful-work percentages (called exergy) cover a wide range from the low teens all the way to close to 100%
- Chemical (fuel) to Thermal (steam) conversion efficiency can be high (90%)
- Thermal to Mechanical energy conversion efficiency is much lower at < 50%
- Mechanical to Electrical energy conversion efficiency can be very high (98%+)
- Potential Energy Conversion (Hydro) to electricity is very high (90%)
- Combining relatively inefficient elements of a steam/power cycle results in a fairly high conversion efficiency
It’s amazing that the turbines (Gas and Steam) that are the workhorses of our power generation infrastructure have pretty low efficiencies (45%) although by combining some of the equipment we can actually increase the efficiency by 33%.
Refer to my post: Energy Types and Conversion Efficiencies for more information on this.