Accounting Financial Sheets Overview
Accounting is the science of tracking and documenting a company’s business transactions (e.g. revenues, expenses, profits, liabilities, etc.).
Companies share their finances with the public via the:
- Income Statement.
- Balance Sheet.
- Statement of Shareholders’ Equity (often included as part of the balance sheet).
- Statement of Cash Flows (or Cash Flows Statement).
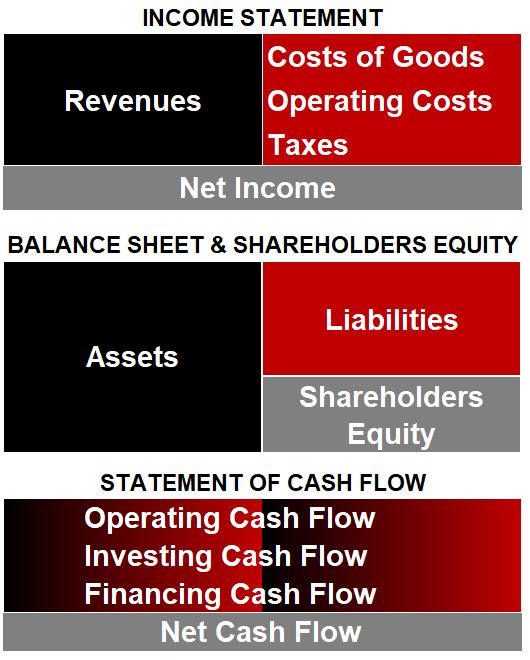
Schematic 1: Accounting Statements
These are shared via the annual report, 10-K filings, and 10-Q filings. Anybody can access these for free via the SEC web page: Link to SEC Web Site.
- You can usually download the annual report for free from the company’s website (Investor Relations section typically).
- The 10-K and annual reports are submitted annually. The 10-K report is numbers oriented while the annual report is a “glossier” package of pictures and explanations.
- The 10-Qs are submitted in the 1st, 2nd, and 3rd quarters of the year (Q4 data is captured in the 10-K submittal).
Income Statement – Revenue and Expenses
The Income Statement indicates, over a specific time period, what the company has made (revenues) and spent (expenses).
Sometimes you will hear the terms Top Line and Bottom Line, which refer to the Revenue (top of income ledger) and Net Income After Tax (bottom of the income ledger).
See Schematic 2 for a listing of the key components of an Income Statement.
The Income Statement starts with Revenue or Sales on the Top Line.
Cost of Goods Sold or COGS are direct costs associated with producing a good or service (e.g. material costs and direct labor costs).
Revenue – COGS gives us the Gross Profit (divide it by revenue and you get Gross Margin).
Production costs associated with Sales, General and Administrative (SG&A) items and other indirect operating costs are subtracted from the Gross Profit to give Earnings Before Interest Tax Depreciation and Amortization or EBITDA (pronounced ee’-bit-dah).
EBITDA is a useful measure because it’s a “clean”, pre-adjusted number, less prone to manipulation.
Schematic 2: Income Statement Details
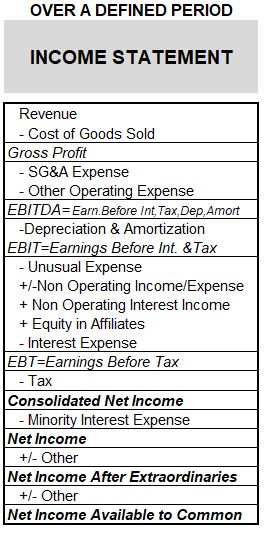
Note: According to Investopedia.com, “In January 2015, the Financial Accounting Standards Board (FASB), which issues the accounting standards that U.S. companies must comply with, eliminated the concept of extraordinary items.”
Income Statement – Adjustments
Over time, asset values waste, that is, they decrease in value (sometimes instantaneously like when you drive your newly purchased car off the sales lot !).
Companies can take a tax credit for this by reducing their revenues by this amount.
Depreciation describes the loss of value over time of tangible (physical assets) while Amortization describes the same for intangible assets like patents or trademarks.
Keep in mind that Depreciation/Amortization is a “paper” adjustment to the EBITDA, that is, there is no actual value lost (well, not necessarily).
It’s done simply so the taxable amount is reduced (its later added back as we’ll see in the Statement of Cash Flows).
The resultant EBIT in Schematic 2 (Earnings Before Interest and Tax and also known as the Operating Profit) is now “adjusted” by several other potential items.
Note that companies are allowed to reduce their taxable amounts by the Interest Expense they’ve paid on issued Bonds.
The resultant EBT (Earnings before Tax) is the tax basis.
Adjusting for taxes, we arrive at the Consolidated Net Income.
This is sometimes called the Net Income After Tax or NIAT.
Note that there are a few other adjustments to income (minority interest expense, extraordinaries and others) that can produce different versions of the Net Income.
Be aware that several useful financial performance metrics are derived from Income Statement data (for example: NOPAT, Operating Margin, Net Profit Margin, P/E, Market Capitalization, Price/Sales etc.).
If you want to get your hands ‘dirty’ and look at real financial statements, then download my XOM Financials Spreadsheet (see introduction section).
I’ve tried to show how the numbers are derived (in the “check” column).
I also derive some useful and commonly used financial metrics as described above.
The Financial Statements are Interconnected
The Income Statement is the first statement that is created.
The Net Income from the Income Statement is used in the Balance Sheet as well as the Statement of Cash Flows.
The Depreciation and Amortization value from the Income Statement is used in the Statement of Cash Flows as well (it was subtracted in order to compute the taxable income, so we have to add it back to the Cash Flows).
Note that there will be supplementary schedules (containing CapEx, Depreciation, Debt, other information) that feed into all the financial statements as well.
Balance Sheet
The Balance Sheet shows a company’s financial position at a specific moment in time.
Whereas the Income Sheet and the Statement of Cash flows represent “net” values over a certain time period, the Balance Sheet is a snapshot in time.
For an annual fiscal period (January through December, for example), a Balance Sheet would be produced at the end of that period on December 31st but it would build (add or subtract) on the previous Balance Sheet (December 31 of the previous year).
The Balance Sheet is described by the Accounting Equation: Assets – Liabilities = Equity.
So, at a specific moment in time, the Balance Sheet shows
- what the company owes (its Liabilities or its debt) and
- what it owns (its Assets).
- the Net Worth or Equity as the difference between Assets and Liabilities.
The Statement of Shareholders’ Equity is included as part of the Balance Sheet Statement.
See Schematic 3 for a listing of the key components of a Balance Sheet.
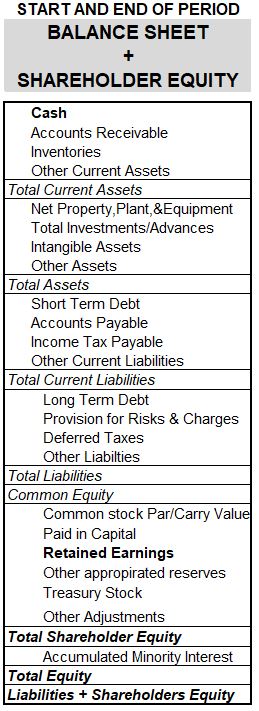
Schematic 3: Balance Sheet & Statement of Shareholders’ Equity
Statement of Shareholders’ Equity
Recall the Accounting Equation: Assets – Liabilities = Equity.
At the bottom of the Balance Sheet (typically) you will find Equity calculations.
Equity is also known as Owners’ Equity or Stockholders’ Equity or Shareholders’ Equity.
Shareholders’ Equity must equal the sum of all the cash inflows/outflows from stock issuances and stock repurchases respectively, cash outflows for dividend payments, and other cash inflows and outflows.
Shareholders’ Equity = Paid In Capital + Net Income – Dividends – Repurchase of Common Stock +/- Other, where
- Paid in Capital = Value from the company’s issuance of stock
- Net Income – Dividends – Repurchased Stock (Repurchased stock is optionally categorized in Retained Earnings) = Retained Earnings
- Repurchased Stock can be listed separately (called Treasury Stock) or included in the Retained Earnings calculation
- “Other” examples: appropriated funds, unrealized gains/losses from investments, currency market gains/losses etc.
Dividends are some portion of the NIAT (Net Income After Tax) that a company can pay back to the shareholders.
Each company decides how much dividend they will pay (or if any at all).
A company that is growing really fast might take all its earnings and plow it back into the business, whereas a much bigger, established company, might decide to take some portion of its earnings and kick it back to its faithful stockholders in the form of dividends.
Several useful financial metrics use data from the Balance Sheet (for example: various debt ratios, ROA, ROE, ROCE, ROACE, ROIC, ROC, Enterprise Value, Book Value per Share, Price to Book etc.).
If you want to look at a detailed example of a Balance Sheet, then download my XOM Financials Spreadsheet (see introduction section).
I’ve tried to show how the numbers are derived (in the “check” column).
I also derive some commonly used financial metrics (like examples given above).
All Three Financial Statements are Interconnected
The Balance Sheet must balance with Assets equaling Liabilities + Shareholders’ Equity.
But this can’t be done without input from the Income Statement (Net Income for the Retained Earnings calculation) and the Statement of Cash Flows (the Net Cash); not to mention various inputs from supplementary schedules (for CapEx and Depreciation and Debt and Interest information).
All three financial statements are interconnected.
So, let’s discuss the Cash Flows Statement.
Statement of Cash Flows – Excludes Accrued Items
The Statement of Cash Flows computes the Net Cash at the end of the defined period.
This value is used by the Balance Sheet to close it out (to balance it).
The Income and Balance Sheets usually count revenues and expenses when they are transacted and not when the actual payment is made.
This is called Accrual Accounting.
But Cash “in hand” is an important indicator of the health of a company’s financials.
So we need one more type of financial statement.
The Statement of Cash Flows (for a defined period) excludes all accrued items and shows the actual cash “in hand”.
So, for example, increases in Accounts Payable are positive cash flows on the Income Statement because even though we owe that money to someone else, we have it now, so we count it now.
Statement of Cash Flows – Cash Flow is King
Cash Flow is King.
A company needs cash to grow. A company needs cash to pay its bills.
The financial manager will focus on how to optimize and grow future cash flows for the company.
In the end, a company has to have enough cash (money at hand) to pay its bills.
So a company might have a lot of money owed to them , but if they don’t have it yet, it’s not immediately useful.
Because of Accrual Accounting, a company can report a profit (Sales – Expenses = Profit) but not have any cash flow. How can that happen?
Here’s one example: A company has to pay for raw material goods to make a product (so cash is reduced).
The company also makes a sale that more than makes up for the cost but the payment is delayed.
On the accounting books, the company made a profit, but at the moment the companies cash flow has dropped, not increased.
See the Appendix for some recommended readings on Cash Flow and related topics like Liquidity.
Let’s dig into the Statement of Cash Flows.
Statement of Cash Flows – “Cashifies” the NIAT by the Depreciation Amount
Refer to Schematic 4 below.
The Statement of Cash flows begins with Net Income and then adds back Depreciation and Amortization that was taken out in the Income Statement.
Recall that EBITDA (Earnings Before Interest Taxes Depreciation and Amortization) was reduced by Amortization and Depreciation in the Income Statement in order to reduce the taxable portion of the income.
The actual amount of money made is the NIAT (Net Income After Tax) plus the Amortization and Depreciation, so the Cash Flows Statement adds it back.
Note the interconnectedness of the Cash Flows Statement and the Income Statement, as both NIAT and Depreciation and Amortization come from the Income Statement.
Schematic 4: Statement of Cash Flows
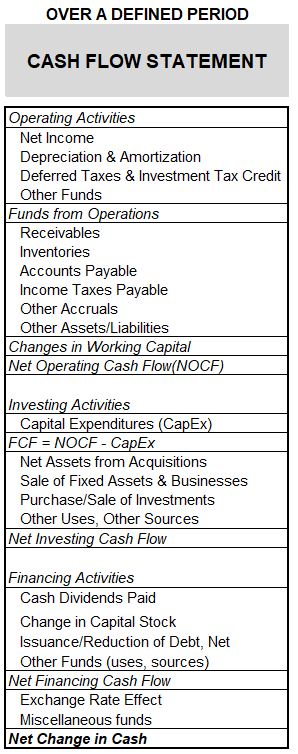
Statement of Cash Flows – Cash in Hand Accounting
In Schematic 4, you can see that the Income Statement is organized into three sections that compute cash flows from
- Operating Activities,
- Investing Activities, and
- Financing Activities.
Like the Income Statement, the Statement of Cash Flows computes net changes in cash for a defined period (e.g. quarterly and annually).
In the Operating Activities, the Net Operating Cash Flow is calculated.
After the NIAT adjustment by Depreciation/Amortization, Net Working Capital cash flow changes are computed (from start of period and end of period Balance Sheet information) for Accounts Receivable, Accounts Payable, Inventory, etc.
Because the Cash Flows Statement is counting the cash “in hand”, increases in liquid assets (like increasing Accounts Payable) result in increases in cash flow and vice versa for decreases in liquid assets (like increasing Accounts Receivable).
Let’s look at a few more examples of working capital changes and cash flow.
Working Capital Changes Effect on Cash Flow
- An increase/decrease (+/-) in Accounts Receivable cause a decrease / increase (-/+) in cash flow. Money owed to you is money you don’t have.
- An increase / decrease (+/-) in Accounts Payable cause an increase / decrease (+/-) in cash flow. Money borrowed is money you still have.
- An increase / decrease (+/-) in Inventory cause a decrease / increase (-/+) in cash flow. You pay for increasing inventory and you essentially get cash for reducing inventory.
The Net Investing Cash Flow is computed next. This reflects all the changes to investment activities during the period (CapEx, purchases, sales, investments).
Note that the Free Cash Flow (FCF) is computed as the Net Operating Cash Flow – CapEx.
This is an important metric that a lot of financial managers track and use (for example via Discounted Cash Flow analysis).
Net Financing Cash Flows are computed last.
These capture all the financing activities like dividend payments, bond and stock issuance, repurchase of stock, payments of debt, etc.
The Net Change in Cash is finally computed as the sum of the Operating, Investing, and Financing Cash Flows.
In the actual process of creating these financial statements, Net Cash Flow computed in the Statement of Cash Flows is fed back to the top line of the Balance Sheet.
The Balance Sheet can now be closed and balanced (hopefully!).
If you want to see a detailed example of a Cash Flows Statement with annotations, you can download my XOM Financial Statements 2021 spreadsheet (see link in the introduction section).
Assembling a Set of Financial Statements
Hopefully it’s clear by now that we need all three financial statements to get a complete financial picture.
The process for creating these statements will generally go as follows
- Supplemental schedules and databases are created/updated and are used to create the statements.
- (e.g. Capital Expenditures and Depreciation tables, Debt and Interest Rate tables, Working Capital schedules, and others).
- These have to be updated periodically.
- Build the Income Statement first.
- Build the Balance Sheet (including Shareholders’ Equity section) second.
- The top line Cash input is left blank until the Cash Flows Statement is completed.
- Income from the Income Statement is used to compute Retained Earnings.
- Retained Earnings are needed to compute the Shareholders’ Equity calculation.
- Build the Statement of Cash Flows.
- Much of the data from the Balance Sheet is used to build the Cash Flows Statement.
- Net Income as well as Depreciation/Amortization numbers are brought in from the Income Statement.
- The Statement of Cash Flows ultimately computes the Net Cash Flow.
- The Balance Sheet is now updated with the Net Cash Flow number from the Statement of Cash Flows.
- The final check is to ensure that Assets on the Balance Sheet equal the sum of Liabilities and Shareholders’ Equity (to honor the Accounting Equation).
- Then we know we are done and the Balance Sheet is “closed”.
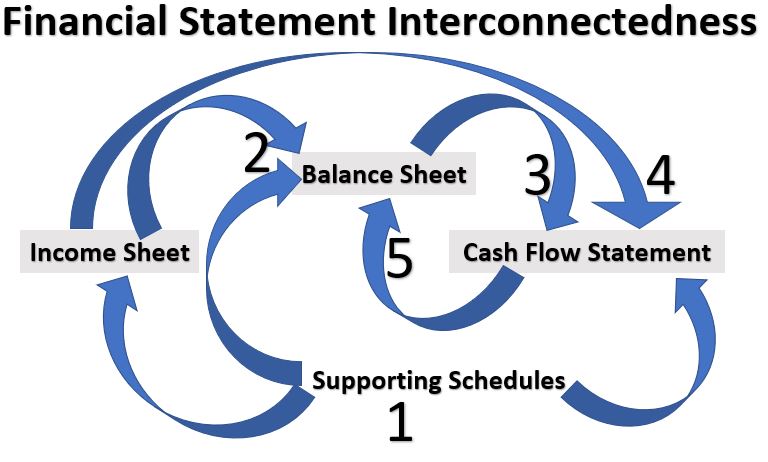
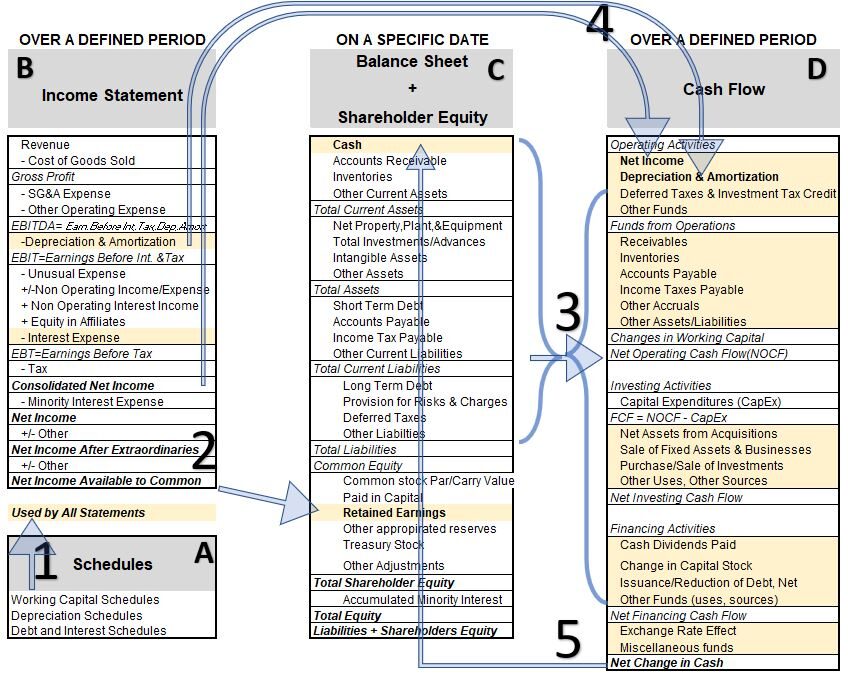
Schematic 5 below , shows, in a general picture, the flow of information across the various statements. For those of you who like a bit more granularity, you can look at Schematic 6 which depicts the same process in a little more detail.
Schematic 5: Financial Statement Information Flow – General
Schematic 6: Financial Statement Information Flow – Detailed
Conclusion
This post has given you a high level accounting primer.
I’ve reviewed the major characteristics of each financial statement and have shown you how they are connected to each other.
If you are a business professional or even just an individual stock investor, having an in depth knowledge of accounting will be a powerful skill set.
But, even if you aren’t directly involved or interested in the business activities of various corporations, you should still benefit from learning the rudiments of accounting. Here are some reasons why I think this is true:
- You learn about material balancing.
- Money, just like Mass or Energy, is conserved.
- Understanding this basic scientific principle and developing a knack for seeing this everywhere in the world around you should help you problem solve better and think more critically.
- The Balance Sheet and the Accounting Equation concepts apply to your financial life.
- Your Net Worth is equal to your Total Assets minus your Liabilities.
- The Cash Flows Statement and the resultant Net Cash Flow concepts apply to your financial life and your budget.
- So building your own Cash Flows Statement, managing your personal budget, and marrying these to your Net Worth tracking, will help you better manage your personal finances.
- Many of the liquidity and debt metrics produced from these financial statements can be used to measure and gauge the health of your personal financial situation. e.g. Current Ratio, Debt/Assets Ratio, etc.
Read this nice article on why we should all learn basic accounting : Online.hbs.edu – reasons everyone-should-learn-basic-accounting
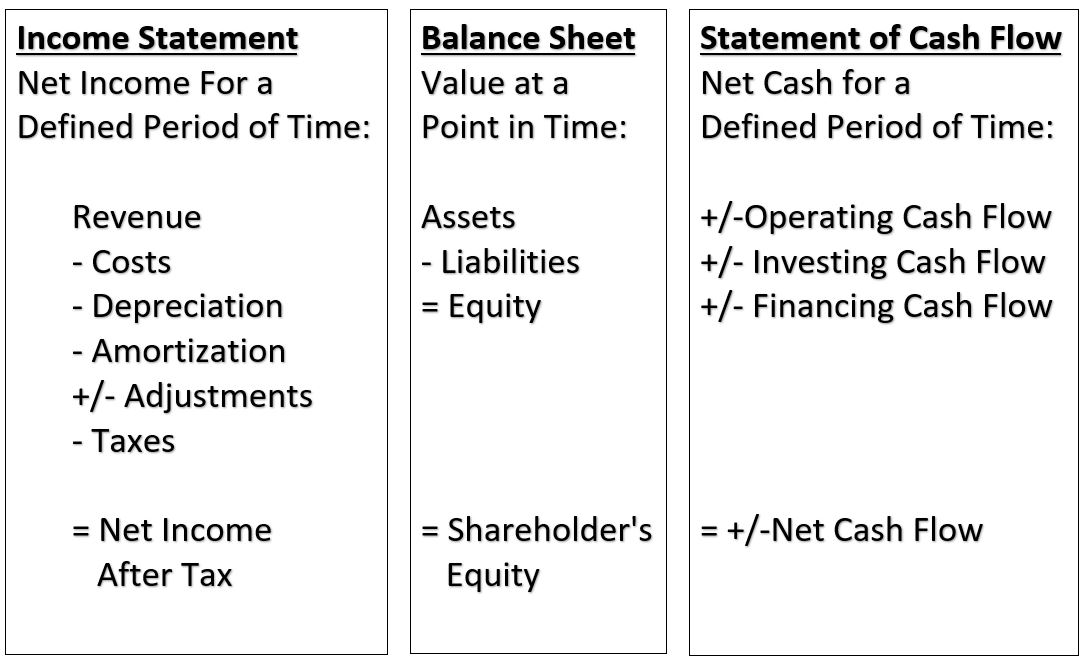
Let’s finish with Schematic 7, which shows high level descriptions for each of the financial statements.
Schematic 7 : General Characteristics of a Corporation’s Financial Statements