Bill Bengen’s 1994 Study
In 1994, William Bengen published a landmark study (“Determining Withdrawal Rates Using Historical Data”) in the Journal of Financial Planning to identify a “SAFEMAX” withdrawal rate
- i.e. the highest initial percentage a retiree could draw from their portfolio without running out of money for at least 30 years.
Using historical market data from 1926 to 1976, Bengen stress-tested hypothetical portfolios (originally a 50/50 mix of U.S. large-cap stocks and intermediate-term bonds) against various economic cycles.
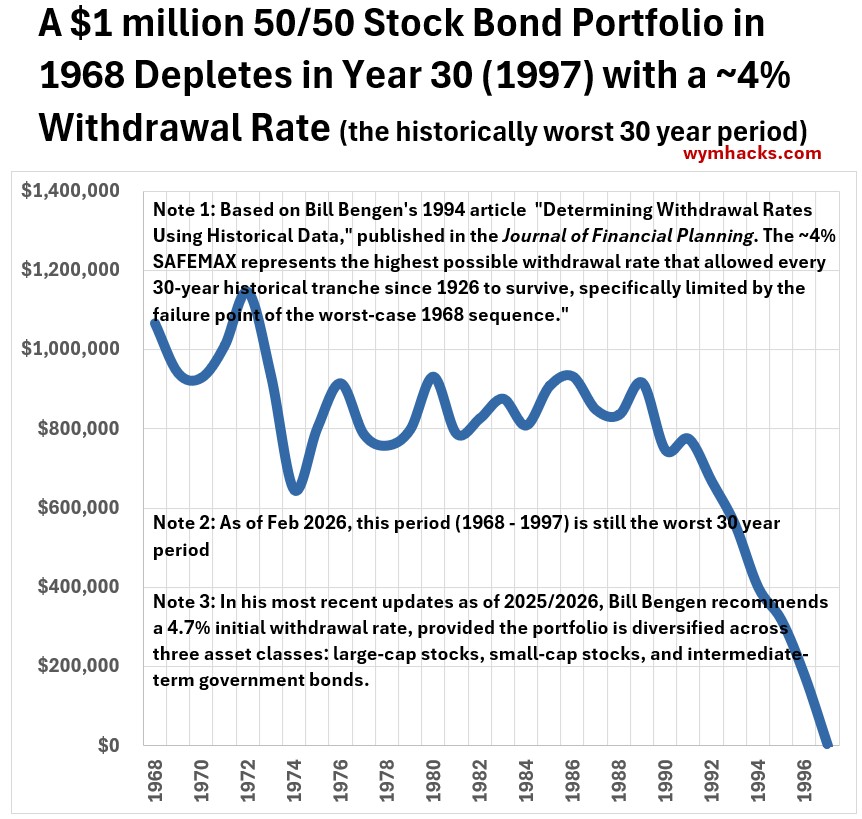
He discovered that even during the “worst-case scenario”—specifically for those who retired in 1968 and faced the stagflation of the 1970s—a 4% initial withdrawal, adjusted annually for inflation, would have successfully sustained the portfolio for three decades.
His Calculation Methodology was Pretty Simple
In a sentence, the portfolio is reduced each year by (1) 4% of the initial balance adjusted for inflation and then (2) adjusted by that year’s market return (for a 50/50 basket of stocks and bonds).
So here’s a little more detail to show you how the first few years of calculations go:
- He studied every 30 year period in the USA from 1926 to 1976
- i.e. 1926 to 1955, 1927 to 1956, 1928 to 1957 etc.. (rolling ranges)
- Since he published in 1994, years 1964 through 1976 were not complete “actual data” sets
- He had 17 – 29 years of actual data.
- He estimated the rest of the data.
- He felt justified in doing this because it’s the first decade that really determines the “fate” of the portfolio
- Computation Method (note: x = multiplied by)
- Yr 1 Calculation
- End of Yr1 Balance = [$1 Million – (4%)(1Mil)] x (1 + Yr1 Market Return% for a 50/50 stock bond mix)
- Yr 2 Calculation
- End of Yr2 Balance = [End of Yr1 Balance – (4%)(1Mil)(Adj for Yr2 Inflation)] x (1 + Yr2 Market 50/50 Return%)
- Yr 3 Calculation
- End of Yr3 Balance = [End of Yr2 Balance – (4%)(1Mil)(Adj for Yr3 Inflation)] x (1 + Yr3 Market 50/50 Return%)
- Etc..for 30 years
- Yr 1 Calculation
Bengen found that a safe maximum (Safemax) of about 4% for the (worst case) period (1968 – 1977) depleted the money in 30 years
Bengen and others have extended the calculation through 1996 (1996 to 2025) and the 1968 to 1977 period is still the worst case scenario.
Graph: For 1968 to 1997: $1 Million Depletes To $0 at a ~ 4% Withdrawal Rate (Adjusted for Inflation)
Calculation Details for 1968 – 1997 Period
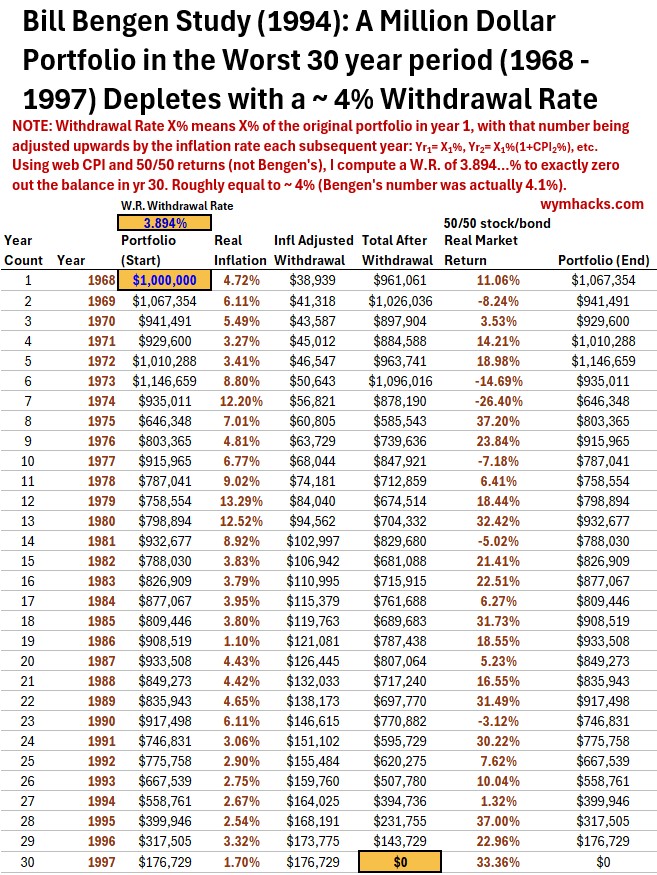
I show the year by year calculation in the tabulation below.
Using online data for inflation rates and market returns (for a 50/50 stock/bond mix), I used an Excel spreadsheet calculator to compute the withdrawal rate required to deplete the 1 million dollars to exactly zero (I used the Goal Seek function in Microsoft Excel).
- Stocks (50%): S&P 500 Index. This covers the 500 largest U.S. companies.
- Bonds (50%): Intermediate-Term U.S. Government Bonds. Specifically, the performance of 5-year Treasury Notes.
The withdrawal rate I compute is 3.894%. This is not exactly Bengen’s 4% number but it’s close enough.
I believe Bill Bengen has stated that he actually computed something like 4.1% and he conservatively rounded his number down to 4%.
So its a pretty close match and probably not an exact match due to the return values used.
Table: 1968 – 1997 Year by Year $1 Million Depletion Calculation
The reason why this period is the worst and is still the worst is that there are significant drawdowns due to both
inflation and
negative market returns
that occur early in the sequence.
The graph below is based on the inflation and market returns of the table above and shows the negative drawdowns that occur early in the 30 year sequence (due to both high inflation and market downturns)
Graph: USA Inflation Rates and Market Returns (1968 – 1997)
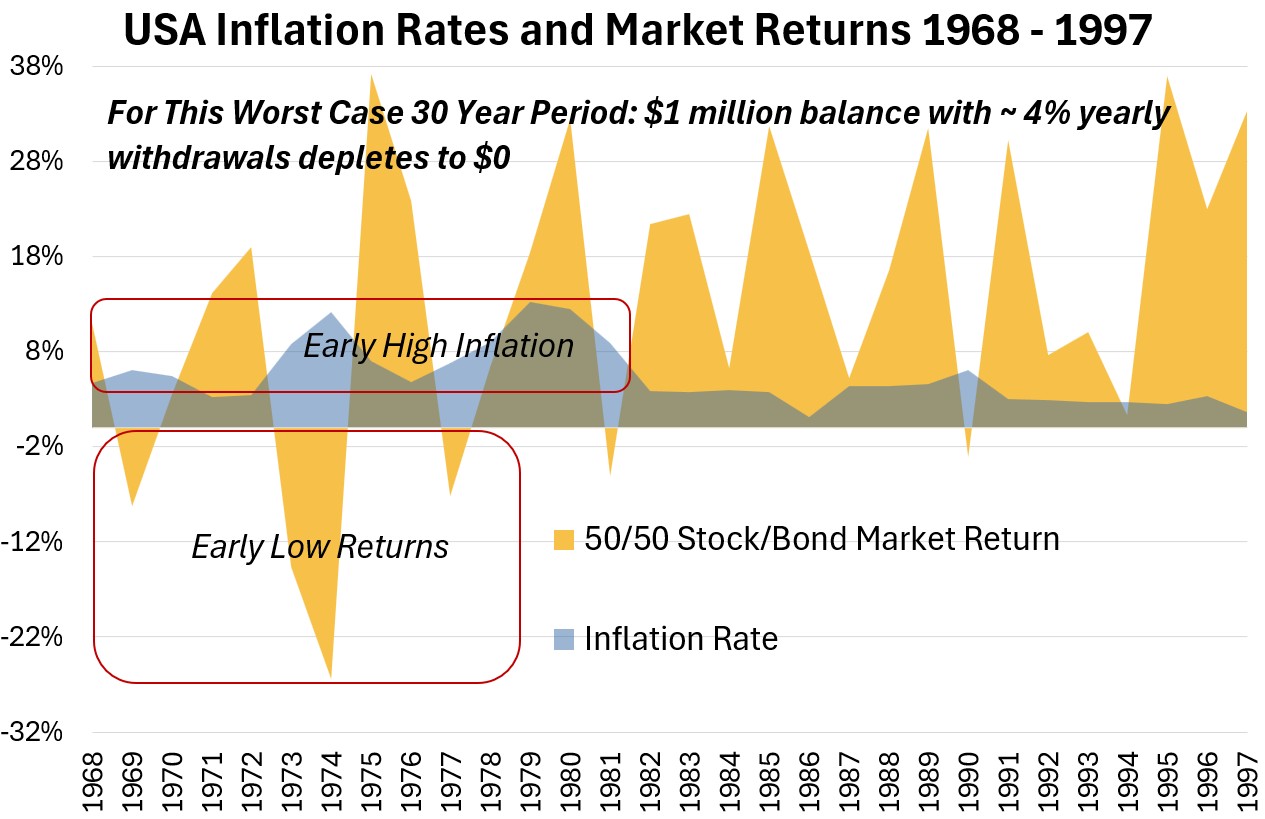
This is the nefarious Sequence of Returns issue that can really mess with the longevity of your retirement nest egg.
Let’s study this a little bit more…it’s important.
Sequence of Returns Example 1
Ok, for example 1, let’s look at a hypothetical (arbitrary) 20 years of market returns.
- We want to do the Bill Bengen computation assuming we start with $1 million and withdraw $50,000 each year.
- I will make up an arbitrary set of 20 yearly returns and order them 4 different ways (so 1 through 20 in different sequences).
- Case 1: Worst Case
- Case 2: Best Case
- Case 3: Random
- Case 4: Random
The return sequences are listed below for each case (Same numbers but in different sequences (order)).
Table1/Ex. 1/Sequence of Return Study (Hypothetical Sequences for Same 20 Returns)
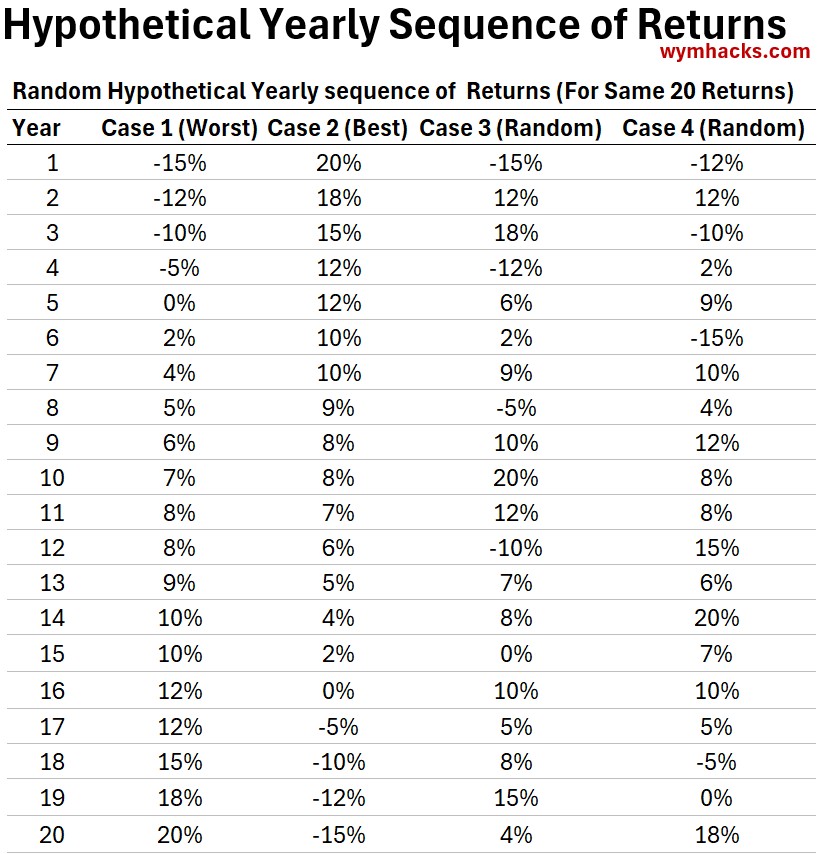
- I’m ignoring inflation adjustments to the withdrawal amounts in these calcs (just to keep it simple but still make the point).
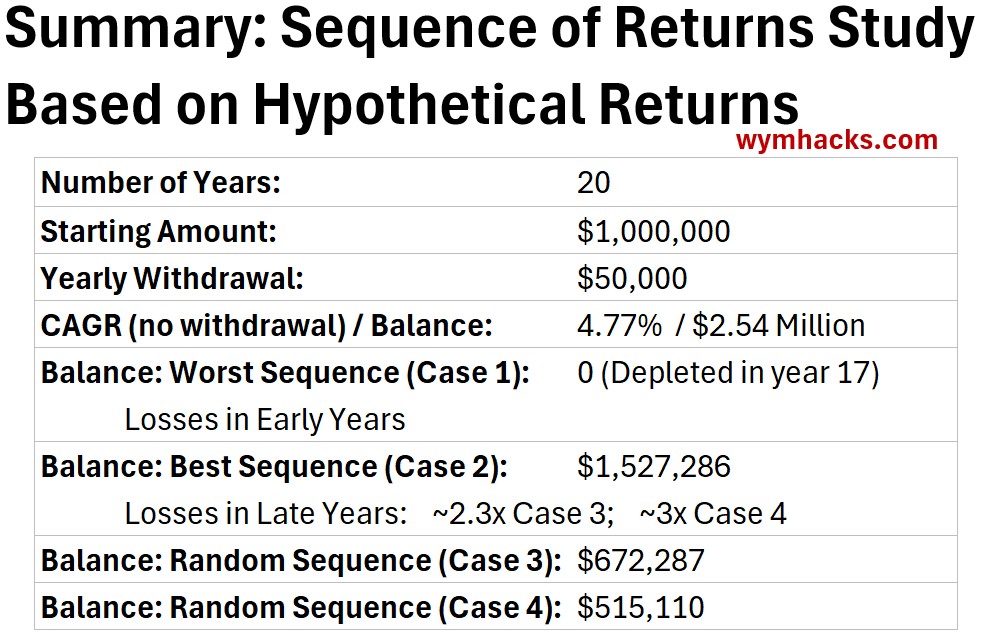
The worst case is Case 1 where the money depletes in year 17.
Notice in the table below that
- if we just let the money sit and we didn’t withdraw anything, then
- the value at the end of 20 years is $2,538,848 (it grew at a compounded annual growth rate or CAGR of 4.77%).
- CAGR formula = (Final Value/Initial Value)(1/N)-1 where N is the number of years.
Table2/Ex. 1/Sequence of Return Study (Case 1: Worst Case: Depleted by Year 17 of 20)
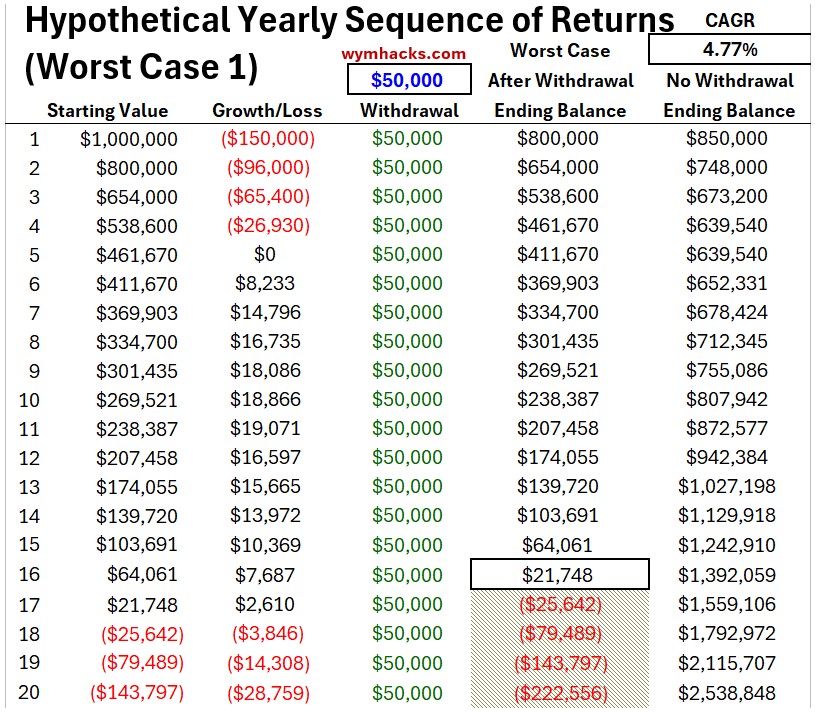
Notice in Case 1 above how we stacked all the negative market returns in the early years.
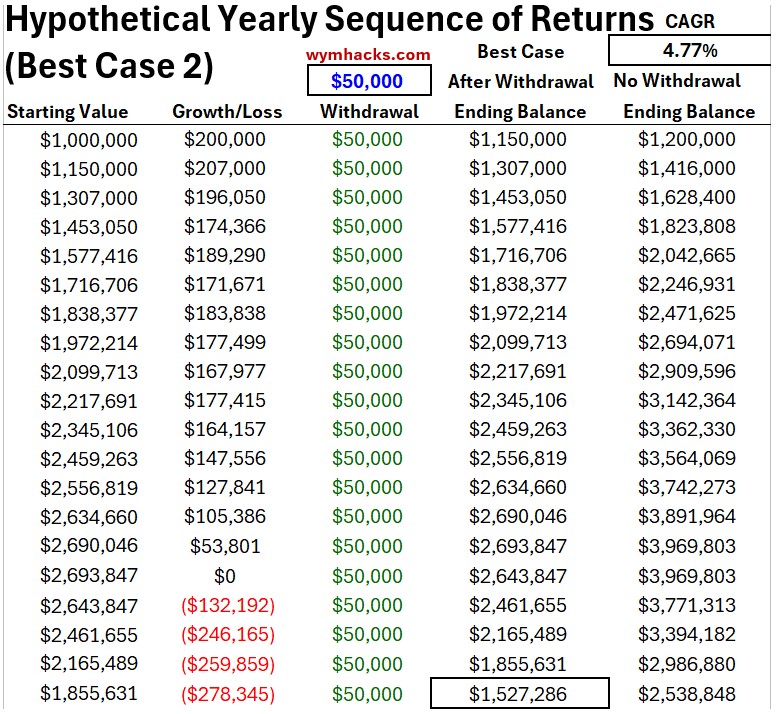
So what happens if we stack all the negative returns at the end of the 20 years?
That gives us Case 2 (see below), the best case example, where we end up with $1.527 Million after 20 years.
Notice that even though the sequence of returns is different, if we don’t withdraw anything, we still get the same final balance of $2.539 Million (for a return or CAGR of 4.77%).
Table3/Ex. 1/Sequence of Return Study (Case 2: Best Case: $1.53 Million in Yr. 20)
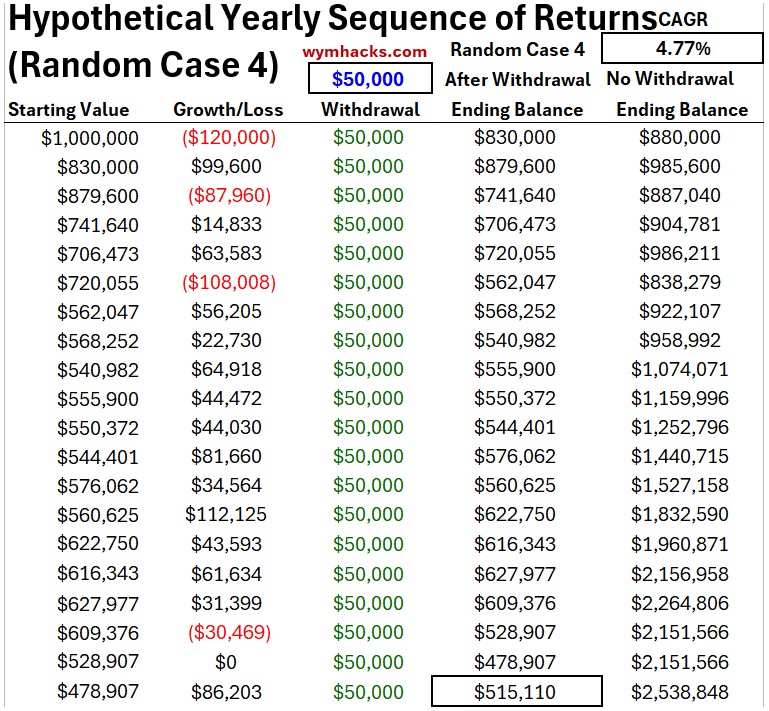
We can run other random sequences and we’ll get different results (see the Case 3 and Case 4 tables below).
Table4/Ex. 1/Sequence of Return Study (Case 3: Random: $0.672 Million in Yr. 20)
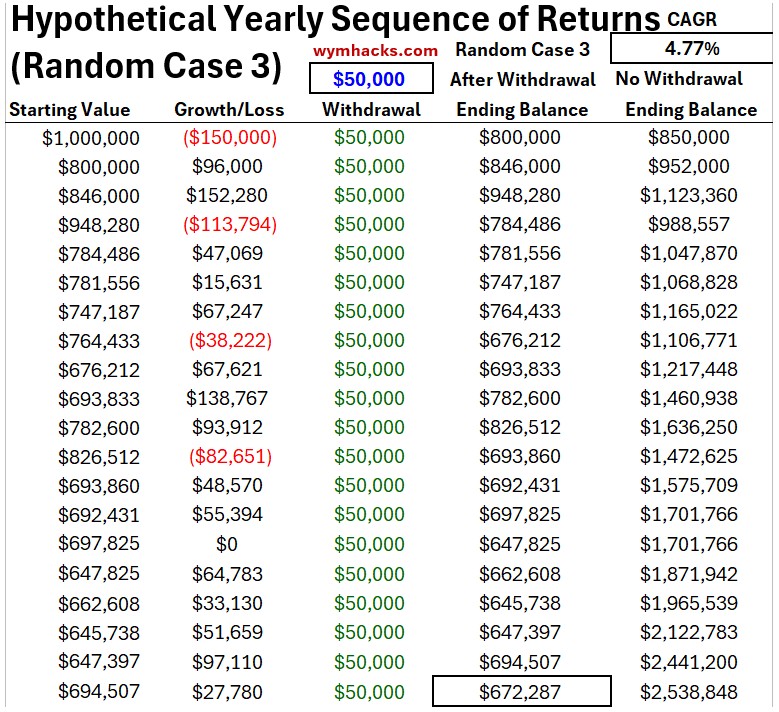
Table5/Ex. 1/Sequence of Return Study (Case 4: Random: $0.515 Million in Yr. 20)
So, when withdrawing monies , the sequence of returns effect is huge.
Table6/Ex. 1/Summary: Sequence of Returns Study Based on 20 Years of Hypothetical Returns
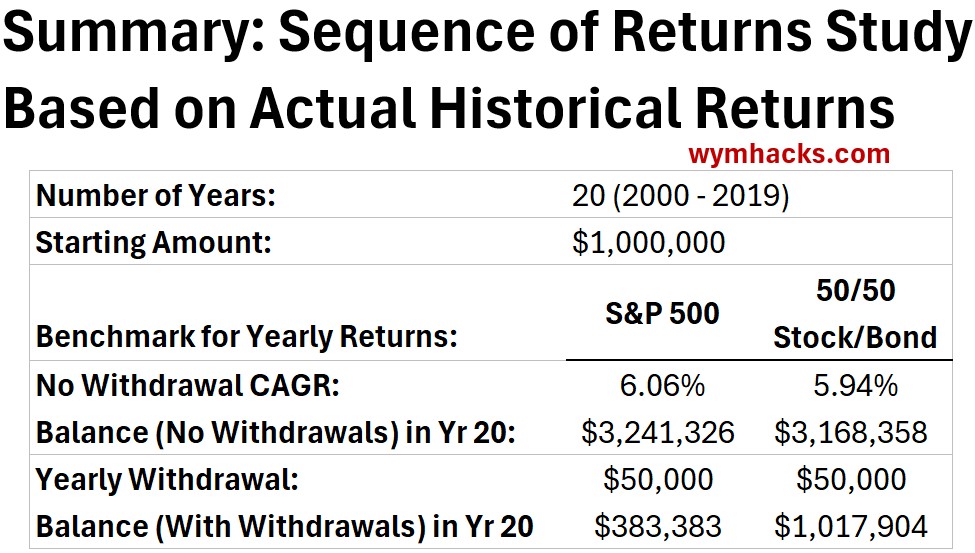
Sequence of Returns Example 2
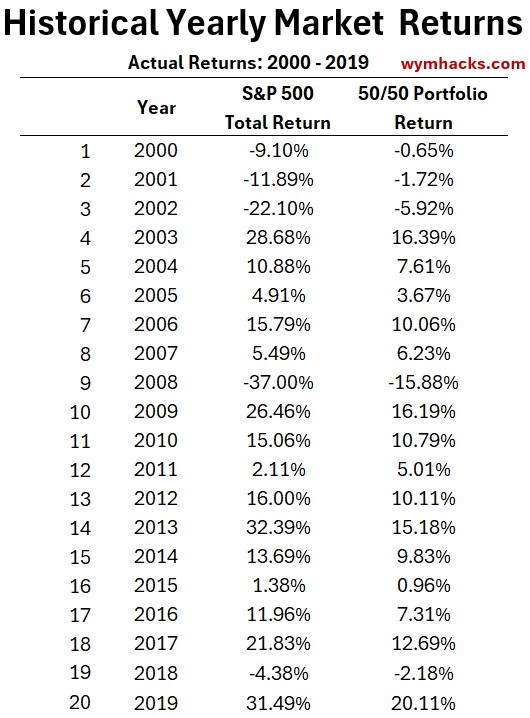
Instead of hypothetical returns, let’s look at an actual 20 year period in the market between 2000 and 2019.
The historical market returns for two different portfolios are shown.
- S&P 500 Index. This covers the 500 largest U.S. companies.
- A 50/50 mix of
- S&P 500 Index
- Bonds: Intermediate-Term U.S. Government Bonds. Specifically, the performance of 5-year Treasury Notes.
The returns for these two are shown below.
Table1/Ex2/Historical Yearly Market Returns
For the 20 year sequence from 2000 to 2019, if we
- started with $1 million and
- withdrew $50,000 each year (no inflation adjustment) and
- adjusted each balance by the market return of the S&P 500
we would get the following table.
Table2/Ex.2/Yearly Sequence of Returns Study/S&P500 Asset Allocation
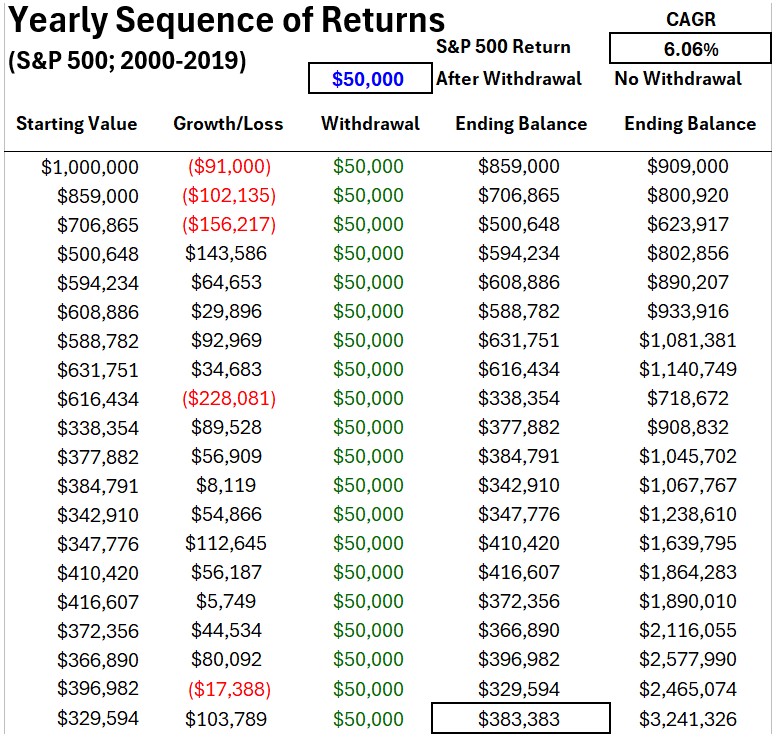
The final balance for this stock only asset allocation is $383,000.
Notice that the no-withdrawal return is $3.24 Million which is a return (CAGR) of 6.06%.
What if we do the same exact calculation for a 50/50 mix of stocks and bonds?
Then we get Table3 below.
Table3/Ex.2/Yearly Sequence of Returns Study/ S&P500+ Bonds 50/50 Asset Allocation
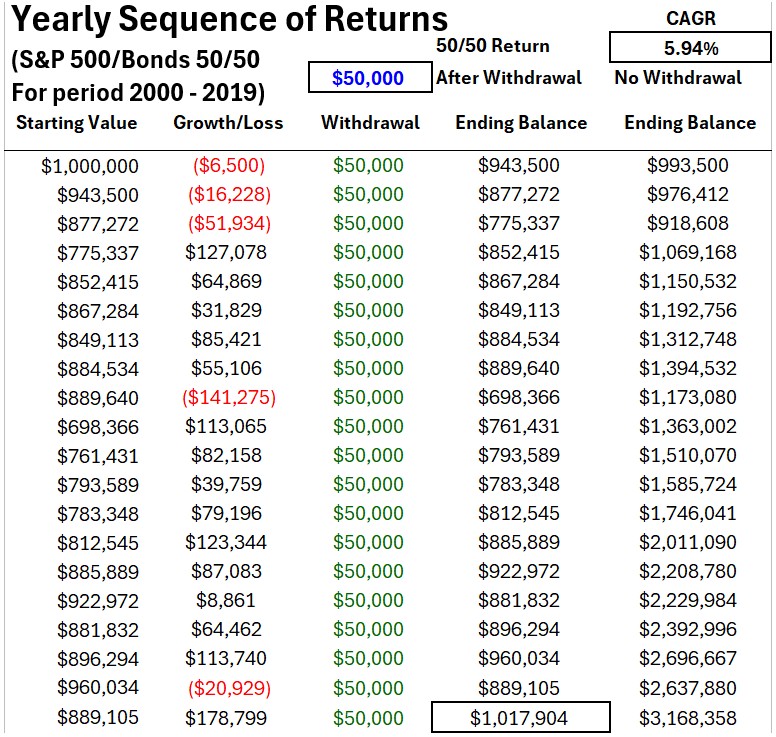
Look at that.
For a 50/50 stock/bond allocation, the final balance ends up being quite a bit larger than the S&P 500 portfolio at $1.018 Million…for an asset allocation whose “no-withdrawal” return is 5.94% which is less than the “no-withdrawal” return of the S&P500 portfolio.
Sequence of returns matters and the portfolio mix affects that sequence of returns.
Key Observations on the 4% Rule
Now let’s address some of the nuances, challenges, and things you have to figure out before you can use this effectively
1. The recommended withdrawal rate is a “Worst-Case” Safety Floor
- The SAFEMAX withdrawal rate is conservative.
- It is the maximum withdrawal rate you could have taken in the worst period in history.
- For all the other historical rolling periods, the SAFEMAX would not deplete your funds (in several historical scenarios you still would have large ending balances).
2. Asset Allocation Determines Your Maximum Withdrawal Amount (SAFEMAX)
- Asset Allocation Matters
- With a 50/50 stock/bond mix, the SAFEMAX is ~ 4%
- Bengen’s 2025 revised SAFEMAX of ~ 4.7% rate is based on a diversified stock mix:
- Large-cap, Mid-cap, Small-cap, Micro-cap, and International.
3. Your Starting Balance will be Unique to You
- Estimate your actual “lifestyle cost” in today’s dollars (all the stuff you pay for in a year including taxes…everything)
- Add 15-25% to that number to account for taxes and health insurance and unknowns.
- Once you have that “All-In” yearly number, you divide by your Withdrawal Rate to find your required starting balance.
- Example: (all in today’s dollars)
- $150,000 expenses – 70,000 social security = $80,000/year
- Don’t include interest earned from investments because you are accounting for that in the market return percent.
- Assume this will be paid out each year by drawing out 4% of your starting balance
- If we have a more aggressive asset allocation than 50/50 with small cap stocks, we can increase this to perhaps 4.7%.
- Let’s stick with 4% in this example.
- So the total balance required will be $80,000/4% = $2 million in today’s dollars
- Or equivalently, the balance required = $80,000 x 1/4% = $80,000 x 25 = $2 million
- $150,000 expenses – 70,000 social security = $80,000/year
4. Sequence of Returns
- Market downturns and/or high inflation force you to withdraw funds from a shrinking balance, locking in losses and accelerating depletion.
- If these events occur early in the retirement period, the effects are much worse (sequence of returns matters).
- This “negative compounding” can permanently damage your portfolio’s longevity before it has a chance to recover.
- By being proactive and having a dynamic strategy, you could mitigate early years depletion damage to your portfolio
- For example: To mitigate the risk of early depletion, you could build structural flexibility into your plan so you aren’t a hostage to market timing.
- This means maintaining a liquid reserve of cash or short-term bonds that allows you to “turn off” stock withdrawals during a down market.
- While this introduces a slight cash drag on your total returns, it provides the essential maneuverability to preserve your principal during volatile years, ensuring your portfolio survives long enough for its equity engine to drive long-term growth.
5. Inflation is the “Silent Killer”
- The Escalator: The rule assumes you take a “pay raise” every year equal to the Consumer Price Index (CPI).
- Stagflation Risk: The 1968 30 year data set was the “unluckiest” because they hit high inflation and a flat market simultaneously.
- Even if the government “can’t afford” high inflation, a short 3-year spike can permanently raise your withdrawal floor, putting massive pressure on the portfolio.
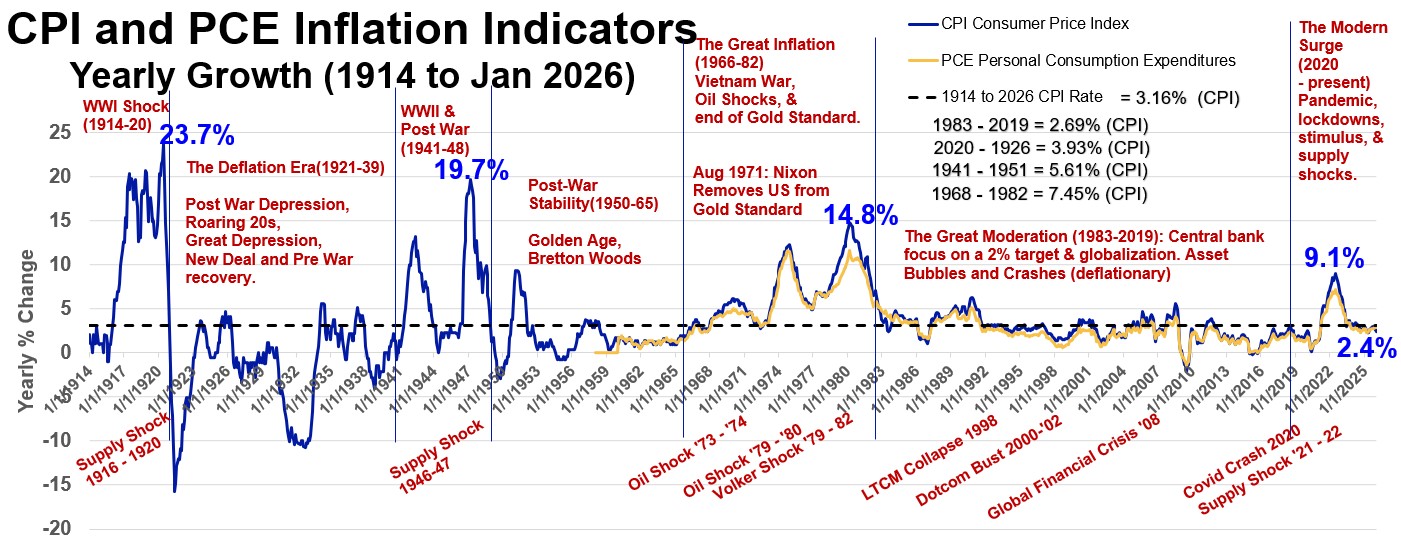
- See the charts below for where inflation has been since 1914 (It’s been greater than 0 about 85.6% of the time)
Graph1_CPI: USA CPI and PCE Inflation Indicators (1914 – 2026) 
Graph2_CPI: USA CPI and PCE Inflation Rates Distribution Histogram (1914 to 2026)
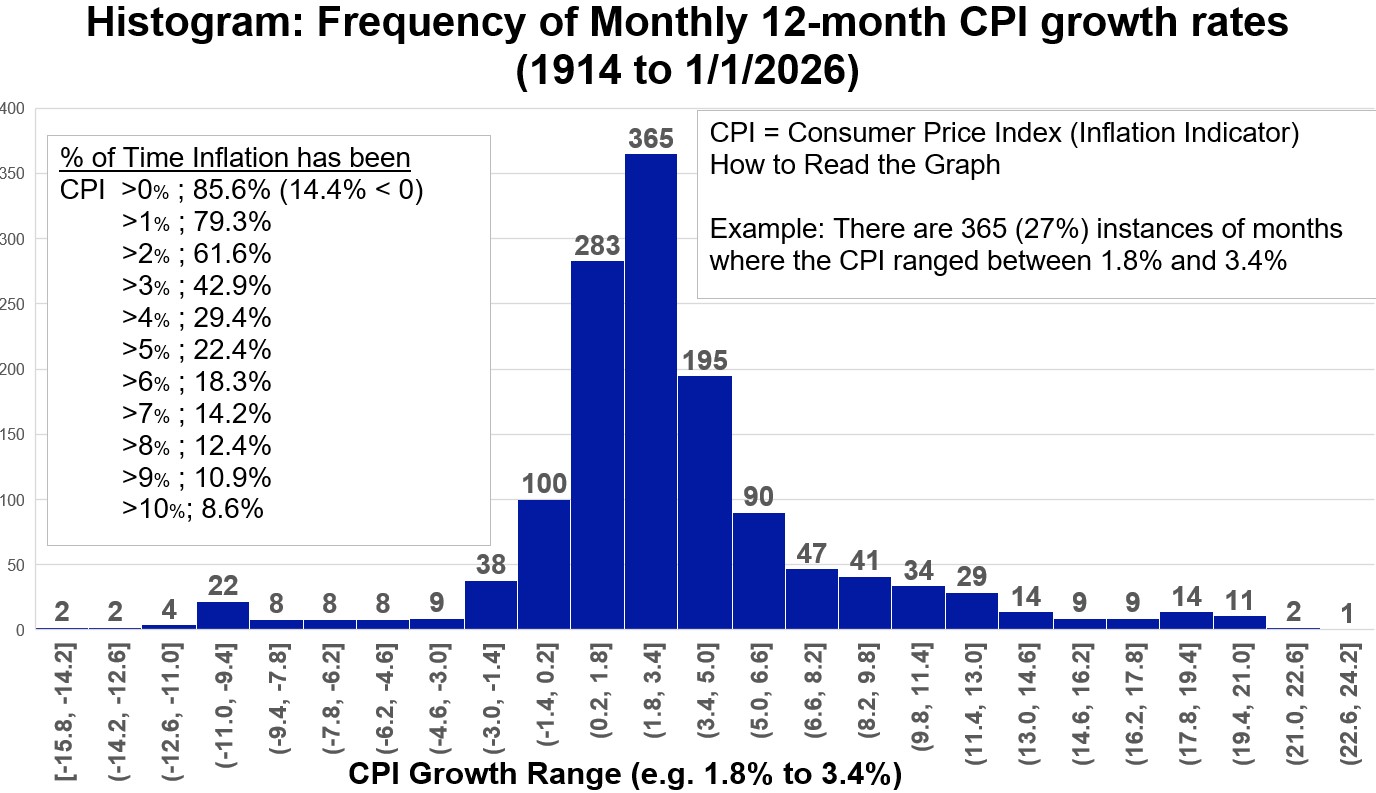
- Long term 1914 to 1/1/2026 Inflation Rate (CPI): 3.16%; Its been greater than 3% about 42.9% of the time.
- I’ve noted the four distinct spikes of inflation rates since 1914: 23.7%, 19.7%, 14.8%, and 9.1% very recently!
- Inflation rates will probably be on the low side as we move forward for one very big , very bad reason: Our national debt is so high right now, we cannot afford the interest on the debt to go much higher.
- When inflation rises: The Fed raises interest rates to make borrowing more expensive, which cools down spending and slows price increases.
- When inflation falls: The Fed typically lowers rates to stimulate the economy.
- You can find monthly 12 month CPI numbers here: https://www.clevelandfed.org/center-for-inflation-research/inflation-charting
6. Flexibility
- Bengen’s Personal Take: Even Bengen admits he spends closer to 5% or 5.5% because he is willing to be flexible.
- Dynamic Spending: If you are willing to skip your “inflation raise” during a bad market year, your starting safe withdrawal rate can actually be higher than 4.7%.
Good article. I forwarded this to Eric and Tom for them to forward to their kids.
Thanks. I cleaned it up a bit and added an implementation section based on some questions another person asked me
Reading this actually helped put me at ease and made me realize that if I stick to this strategy, I should be ok. A couple take-aways are to be flexible with your withdrawal rate and have a good idea of what your discretionary and non-discretionary expenses are so you will be able to make necessary adjustments.
Thanks Rich!