Last Revision: August 31, 2022
Introduction
In this post, I’ll provide a basic description of corporate stocks and bonds.
I’ll first introduce them in the context of the overall cash flow in a corporation, and then I’ll provide some key characteristics for each.
Why should we care about this? Why is this important? Well, humans own, operate, or otherwise work in businesses. These businesses create, maintain, and improve our standard of living and provide our livelihoods. We’ll avoid politics here about whether some businesses are better for society than others. In the end, they all employ people and they all (most!) pay taxes. In addition to these benefits, most of us participate in their wealth creation by purchasing stocks and bonds.
In a previous post, (Link to post on Defining Economics, Finance & Accounting), we stated that the corporation was the engine of Capitalism and we defined what economics, finance, and accounting meant. You might want to refer to this post first before you read this one. Also, consider reading my post on historical stock returns.
Refer to the Financial Glossary as needed.
Corporate Cash Flow – General
A good place to start to understand stocks and bonds is to see how cash (money) flows in a corporation.
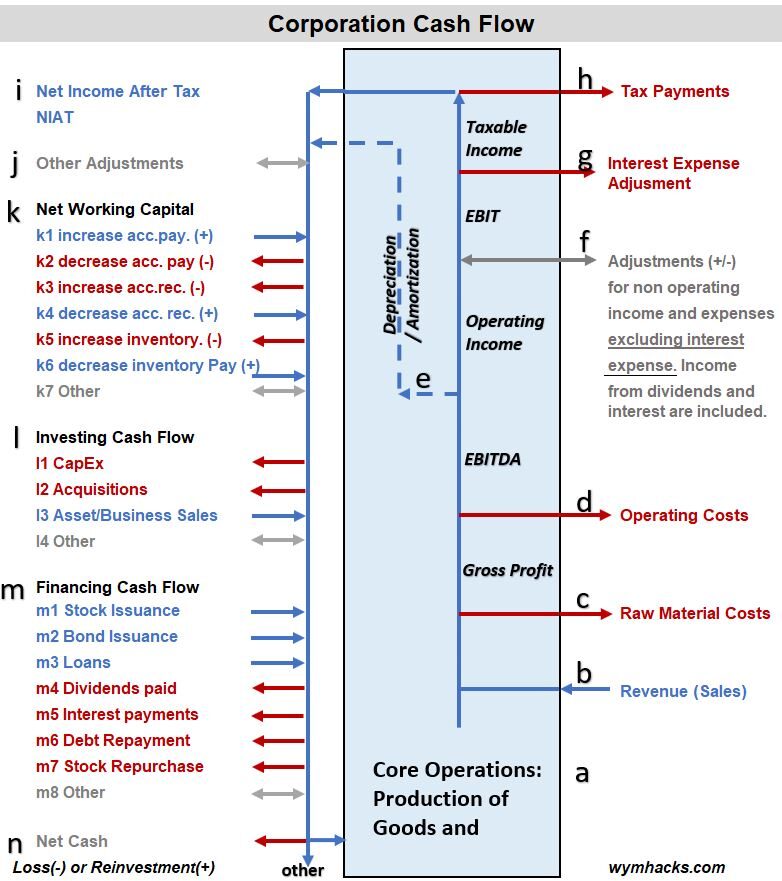
Refer to the cash flow diagram in Schematic 1 below. It shows the inflows and outflows of cash from a typical public corporation (i.e. one that has shareholders). The big blue box represents the core operations of a corporation and the red outbound arrows represent cash leaving the corporation (money spent). The blue lines/arrows represent cash that the corporation possesses or is bringing in. For completeness and just to remind the reader that there are numerous possible “ins and outs”, I’ve included grey lines for various cash flows that could be entering or exiting the corporation. For now don’t try to figure exactly what all the items mean; just look at this drawing holistically and note the following:
- As long as we know all the inflows and outflows, we can do a “material balance” by adding all the inflows and subtracting all the outflows.
- We can account for all the numbers and gauge the health of the company. For example, is net cash (n) positive (good) or negative?
- All company stakeholders will be interested in this “balance of cash flows”. The managers will need to analyze the data and determine what the future steps need to be (to implement a strategy to correct losses and/or improve gains). The company owners and lenders will also be keenly interested in this information to determine their next investment moves.
- If the above can be done in a consistent and structured way, then people can follow standardized procedures to record, report, and analyze the data. That’s what the science of Accounting does.
Schematic 1 (Flow Schematic Showing Cash Flow in a Corporation)

Corporate Cash Flow – Description
The cash flows shown in Schematic 1 are predominantly the components of a corporation’s Statement of Cash Flows (a financial statement it must publish annually). You can assume that we are specifically talking about publicly traded U.S. corporations in this discussion, although I would expect that most terminology used in this post will be valid for European companies as well (The US and Europe follow different accounting standards).
The corporation spends money to produce goods and services ((a) in Schematic 1). Initial funding might come entirely from issuing stocks and bonds (m1 and m2). Eventually, funding would come from net cash (n) generated by the corporation from revenues (b) and other sources (j, k, l, m).
Company revenues or sales (b) are offset by various material and operating costs (c and d). Taxation (h) of the remaining revenue is done after adjustments (e) for depreciation, amortization, loan interest payments (g) and other non operating income and expense adjustments (f) . The net remaining cash (i) is then used by the company in the most efficient way (j, k, l, m), including
- Investing in new projects (Capital Expenditures or CapEx)
- Adding additional funds to existing projects,
- Buying or selling other assets and/or securities,
- Providing stock dividend payments to shareholders,
- Repurchasing company stock (own stock),
- Paying back loans
- etc.
Any residual (net) cash (n) is put back into the business for various uses.
Two major sources of funding for publicly traded companies are Stocks and Bonds (m1 and m2 in Schematic 1).
A Business Needs to Pay for its Assets
Corporations possess assets (tangible assets like equipment and intangible assets like brand names or patents) that have to be paid for (funded). Corporations obtain funds by
- borrowing (for example bonds or other debt(*) instruments).
- selling (originally and additionally) shares of stock to the corporation’s shareholders.
- retaining and reinvesting cash flow
Stocks and Bonds are the two major Securities that companies use to secure funding. The word “Securities” implies that they are secure and tradeable in open markets.
(*) Debt has an interesting spelling. The silent b honors the fact that it has Latin roots (debere = to owe) Source: https://www.merriam-webster.com / dictionary/ debt
Securities
Securities can take the form of :
- Debt Securities (e.g. bonds and similar instruments)
- Equity Securities (e.g. common stocks)
- Derivatives (e.g. options, futures and others that “derive” their value from some underlying asset )
In this post, we’ll focus on stocks and bonds.
Securities – Bonds
Governments and companies often borrow money by issuing bonds. Bonds are long term (*) IOUs (**), in which the lender loans money for a fixed period of time (during which the lender receives interest payments. ) When the bond matures, the lender gets back the face value of the bond (called the Principal) plus any final interest due.
(*) Long Term means longer than 1 year. For example a company might issue a 10 year Corporate bond. There are short term borrowing instruments as well (bank loans, commercial paper etc.) (**) IOU means I Owe You i.e. a promise to return the loan.
Bonds are categorized as Fixed Income Securities as they produce regular payments (interest) to the holder. In addition to corporate bonds, the following securities are all considered fixed income investments: US Treasury securities, mortgage-backed securities, municipal bonds, money market funds, and a few others. According to ICMA , as of August 2020, the total value of the global fixed income market was estimated to be about 128.3 Trillion USD (yes, that’s a T !)
- Corporate bonds make up about 40.9 Trillion USD (~32%) of this total and
- U.S. Corporate Bonds make up about 10.9 Trillion USD of that.
- This data was obtained from the following web site :https://www.icmagroup.org/market-practice-and-regulatory-policy/secondary-markets/bond-market-size/ . The numbers will look a little different today (2022) but the order of magnitude should be similar.
You can buy bonds and other fixed income securities through a brokerage account (or your company’s retirement savings account). They can be purchased individually or in pools or “baskets” via mutual funds or ETFs (Exchange Traded Funds).
Securities – Stocks
Stocks are initially issued by companies (in what is called a Primary Market) in order to raise cash for funding (called an Initial Public Offering or IPO). Stocks represent a fractional ownership in the company (as a % of the total number of shares issued). After the initial issue, stocks are bought and sold in a Secondary Market between investors. The company DOES NOT directly gain or lose value with the rise and fall of the stock price. The Secondary market is what the typical individual investor with his/her brokerage account is investing in
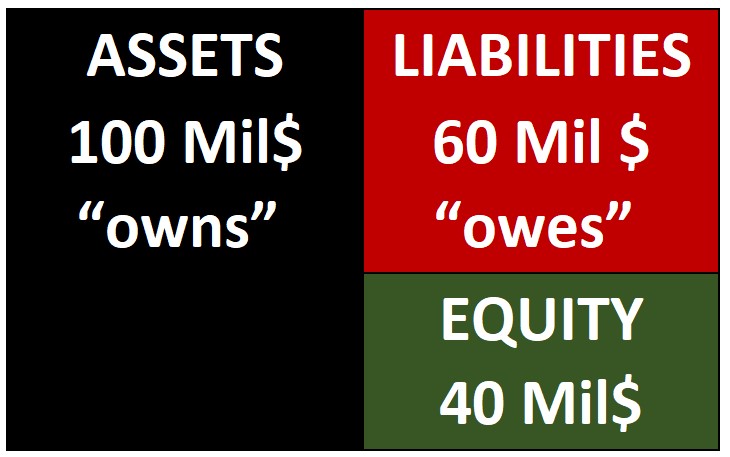
What do we mean by a fractional owner of a company (*)? The box below in Schematic 2 shows a simplified summary of a company’s financial condition. Assume it owns 100 million USD and it owes 60 million USD. We can translate the schematic into an equation: Assets = Liabilities + Equity. This is called the Accounting Equation.
Schematic 2 (Simplified Corporate Balance Sheet Example)

The accounting equation defines Equity as what the company owns “minus” what the company owes. A company shows this information in a financial statement called the Balance Sheet. Stock owners have fractional ownership of the Equity (aka Owners Equity, or Shareholder Equity). The total Equity in the example in Schematic 2 is 40 million USD. Assuming there are 5 million shares of stock, the price per share is 40/5 = 8 $/share (this is called Book Value per Share). Note that Book Value per Share will typically not equal the actual market price of the share i.e. Book Value and Market Value are not necessarily the same.
(*) If we bought some of this companies bonds, we would become fractional lenders of this company as well.
Global Stock Market Value
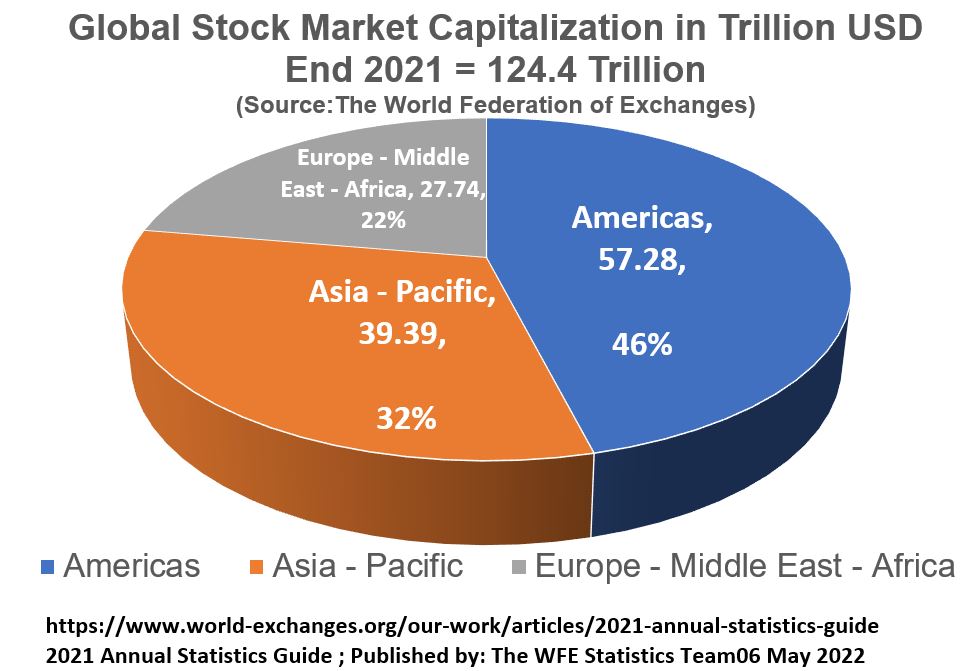
The total world stock market value at the end of 2021 was estimated to be 124.4 Trillion USD. See Schematic 1 below. Note that the Americas component (91% of which are US stocks) is 46% of the total. Many investors will include an international stock component to their asset allocation in order to participate in stock markets outside the USA.
Schematic 3 (2021 Global Stock Market Capitalization)
Stocks can be purchased through your brokerage account (or your company’s retirement account). You can buy them individually or in pools or baskets (via mutual funds or ETFs).
Conclusion
Stocks and Bonds have been defined in the context of a corporation’s cash flow. Corporations finance their operations by primarily issuing stock or borrowing money via bonds or other loans. The global market value of stocks and bonds is huge (roughly 250 Trillion USD). By investing in publicly traded stocks, we can participate in the growth and wealth creation of these corporations.
Appendix
Recommended Reading and Web Links
- Principles of Corporate Finance, 12th Edition; Richard A. Brealey; Robert C. Merton; Franklin Allen; Published by McGraw-Hill Education, 2 Penn Plaza, New York, NY 10121. Copyright © 2017 by McGraw-Hill Education.
- World Federation of Exchanges at https://www.world-exchanges.org/
- The Securities Industry and Financial Markets Association at https://www.sifma.org/
- International Capital Market Association ICMA at https://www.icmagroup.org/
Disclaimer: The content of this article is intended for general informational and recreational purposes only and is not a substitute for professional “advice”. We are not responsible for your decisions and actions. Refer to our Disclaimer Page.

