College Education Costs Have Skyrocketed!
College Costs have Significantly Outpaced Inflation
In the United States, higher education costs increase year after year and at a rate faster than any other good or service. The same can be said for private schooling on any level.
Take a look at Schematic_2.1 below, courtesy of ourworldindata.org.
Schematic 2.1: Price Changes in Consumer Goods and Services in the United State
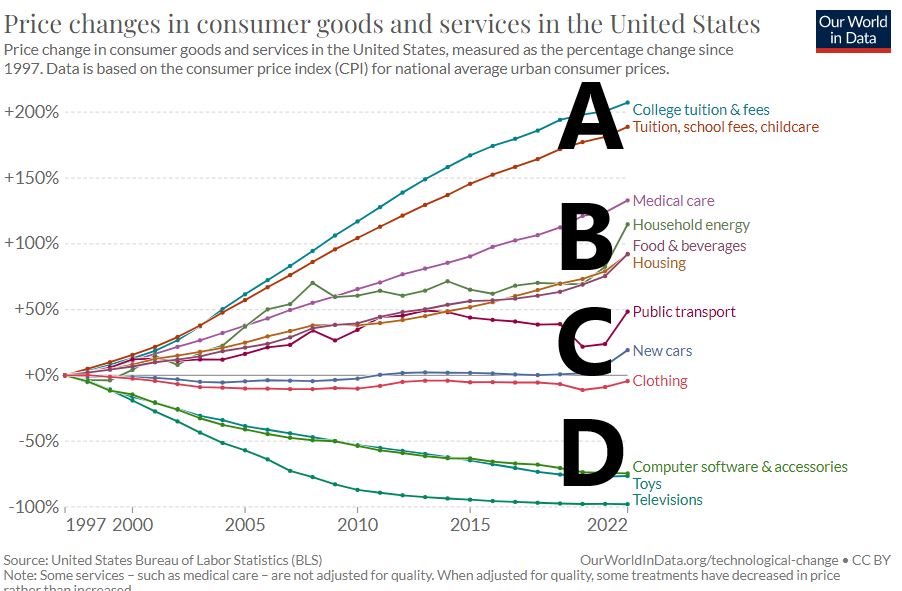
According to Schematic_2.1, the price of college tuition (A on the graph) doubled (**) since 1997 ,but computer related items and TV costs (D on the graph) dropped significantly. Some economists argue that price levels and the extent of government intervention correlate inversely. For higher education the intervention comes in the form of government loans (more on this in later sections).
(**) It’s more than this I think. I looked at data from the U.S. Department of Education, National Center for Education Statistics for the period 1997 to 2022. I compute the following: For all 2 and 4 year institutions, average prices have increased by the following factors:
- All Institutions (1997 to 2022 cost increase factor): 2.7x
- Public Institutions (1997 to 2022 cost increase factor ): 3.1x
- Private (for-profit and not-for-profit Institutions 1997 to 2022cost increase factor ): 2.6x
Check out Schematics_2.2 and 2.3 below which I generated from the U.S. Department of Education, National Center for Education Statistics Table 330.10.
In Schematic_2.2, the average tuition costs for all institutions, public institutions, and private institutions are plotted over time.
Schematic 2.2: 4 Year College Yearly Tuition + Fees in Current (not adjusted for inflation) Dollars
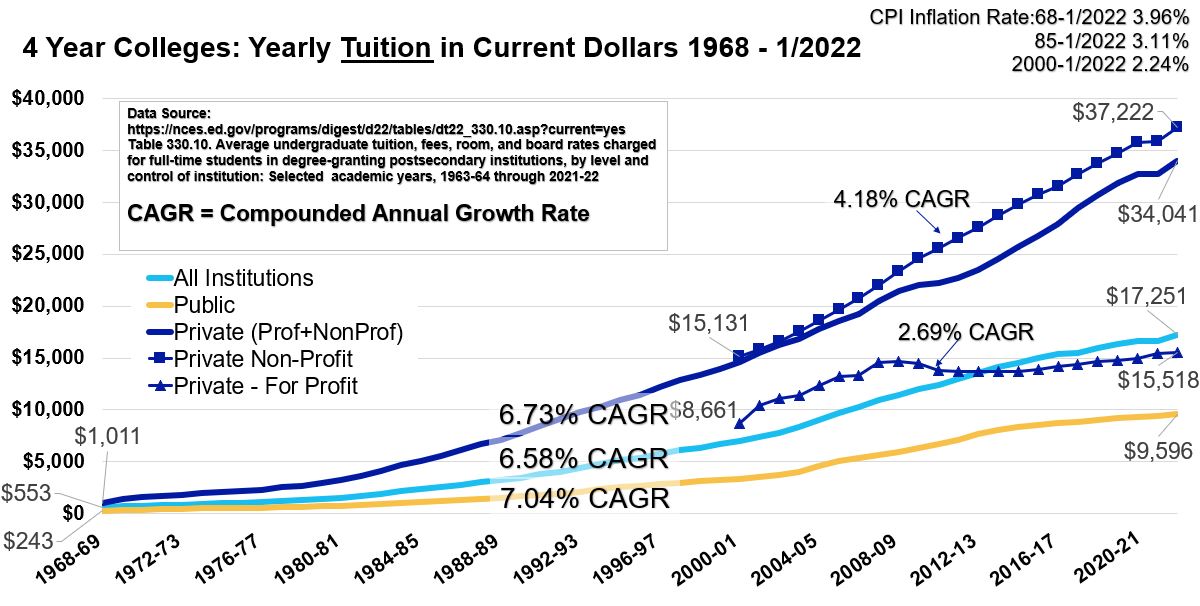
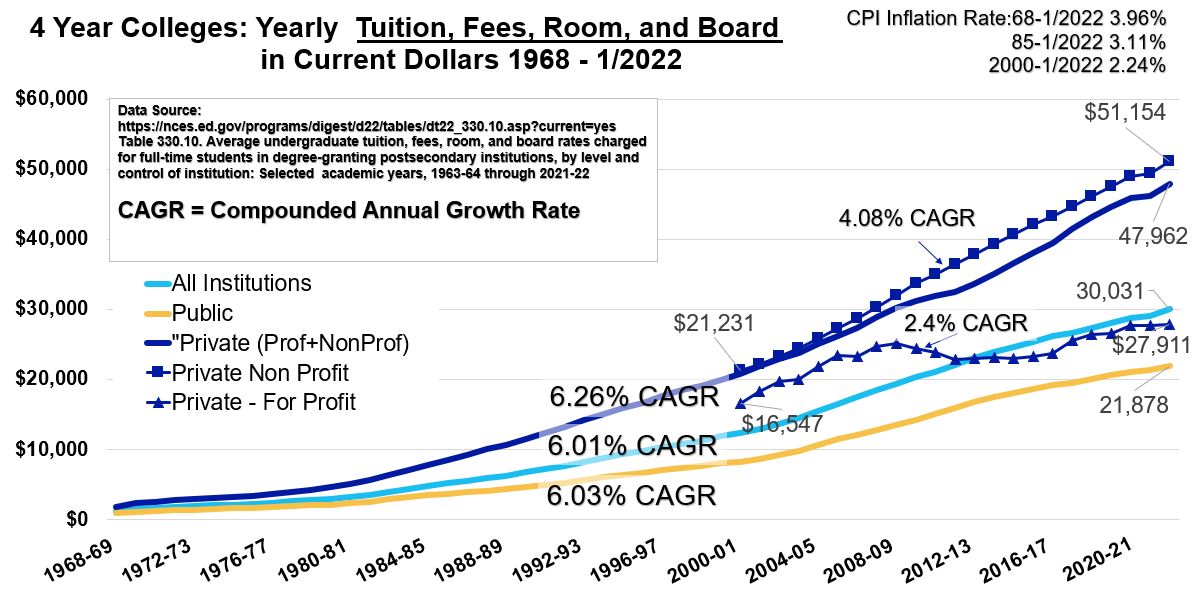
So, for example, for private for-profit and non-profit colleges, the average tuition (only tuition) cost was about $34,041/yr in 2022.
- The Compounded Annualized Growth Rate (CAGR) from 1968 to 2022 was 6.73%. You can compute the CAGR with this formula (CAGR = (End Value/Beginning Value)^(1/periods) – 1). So 6.73% =(34,041/1011)^(1/54)-1. For Private colleges, the average price increased by about 33.7 times (or 3367%).
- Or we can describe the growth using the lump sum compounding formula: 1011(1+.0673)^54 = $34,041.
- The CAGR of 6.73 is 6.73/3.96 = 1.7x the rate of inflation for the same period. Because of the compounding effect, this difference is huge over 54 years: The growth factor is (1.0673)^54= 33.7x for tuition increases versus (1.0396)^54 = 8.14x for general inflation increases.
- The growth factors will vary based on the time period you choose. For example, if we just look at not-for-profit private schools from 2000 to 1/2022, the growth rate was 4.18%. Compared to the inflation rate for this period, tuition grew 4.18/2.24 = 1.9x.
- No matter how you slice it, average college costs have grown much faster than inflation. (let’s say 1.5x to 2x depending on what you measure and what timeframe you use).
- One exception since 2000 is for-profit private college costs growth which is roughly 20% higher than the general inflation rate. The numbers of these kinds of schools peaked out in 2012 and have essentially fallen ever since. Some have entered bankruptcy (See Corinthian Colleges , ITT Technical Institute, and Education Corporation of America) and others have been accused of overcharging and under delivering.
Don’t Forget Room and Board and Other Expenses
Sadly, we are only talking about tuition and fee costs in the above graph. On average, I estimate that room and board and food costs will run you an additional $16,000 /year.
Schematic_2.3 shows the average total costs (tuition + room and board and other expenses). Look at the average yearly total cost for non-profit private colleges at $51,154/year !!
Schematic 2.3: 4 Year College Yearly Total Cost in Current (not adjusted for inflation) Dollars
If you scour the internet, you will find articles claiming that college costs have risen as high as 5x the inflation rate. If you pick the right start and end data and do the CAGR calculation you can probably get these higher numbers. Just remember that the compounding effect will make a big difference even when the number is much smaller that 5x (Most of my computations resulted in 1.2 to 2x the inflation rate which still produce very large differences).
Averages
All the cost data shown in the graphs above are based on averages. With averages you need to be very careful. An average tells you the most typical value. But this assumes that the distribution is normal (i.e. you get a symmetrical bell shaped distribution curve when you plot frequency vs value ranges; You can use Microsoft Excel to do this). The more the distribution deviates from normality, the less meaningful the average will be.
I used a massive data base compiled by Collegescorecard.ed.gov to take a look at the distributions. For public institutions , the cost distributions are skewed to the right, meaning the average is going to be larger than “typical”. You can look at the mode (most common value) or median (the middle value) to see what typical might mean.
For private institutions, the distribution is more even but very irregular. All this to tell you that the average might not really be meaningful to you. For initial estimates, you have to start somewhere so I would recommend you go to https://educationdata.org/average-cost-of-college.
But you wont really get a working idea of your actual cost until you narrow down your college selection (public or private, in-state or out-of-state, etc.).
High Cost Colleges
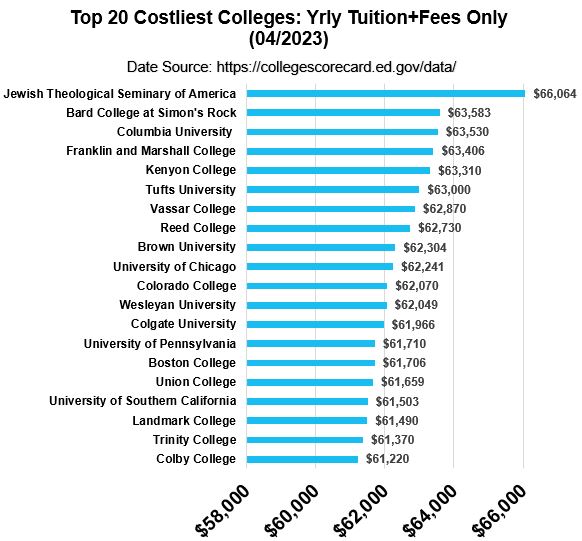
Case in point, look at the (absolutely ridiculous?) costs of the following universities which I compiled from Collegescorecard.ed.gov . Schematic_2.4 shows the top 20 college tuition-only costs. The top 20 universities based on total cost are shown in Schematic_2.5.
Schematic 2.4: Top 20 Costliest Colleges: Yearly Tuition + Fees Only
Schematic 2.5: Top 20 Costliest Colleges: Total Cost
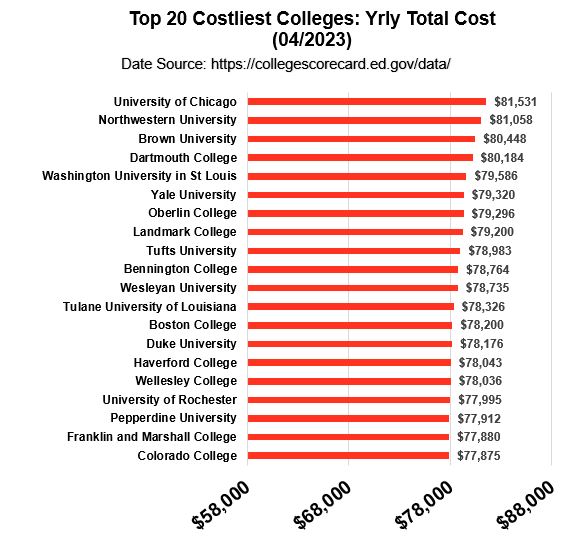
So, let me get this straight; an undergraduate degree from the University of Chicago costs approximately $81,531/year? Assuming your kid gets out in 4 years, you will have paid $326,000 !! According to the Collegescorecard.ed.gov data set, there are 250 schools that have tuition and fees > $45,000/yr. Let’s add an average $16,000 for additional expenses and that comes out to $61,000/yr total costs for over 250 universities. ($244,000 /4 years). H.F.S.
Why on earth are college costs skyrocketing like this? Read on.
Why are College Costs so High?
I’ve provided some reasons below for why college costs have increased much faster than the general inflation rate. Keep in mind that
- Many of the reasons are not mutually exclusive making this a multivariable problem to solve.
- Several of the proposed reasons are intriguing enough to warrant deeper study, but we’ll only present some broad strokes in this article.
1. Basic Economics
Supply prices are going to rise as demand rises. There are a limited supply of university slots available today. Lots more demand than supply gives these institutions massive leeway to raise prices. Why would a university stop raising prices if people are constantly willing to pay those prices? What is driving demand?
Demand: College Degrees Increase Pay
Fundamentally people believe that a college degree will raise their standard of living above those who don’t have college degrees. The data bear this out:
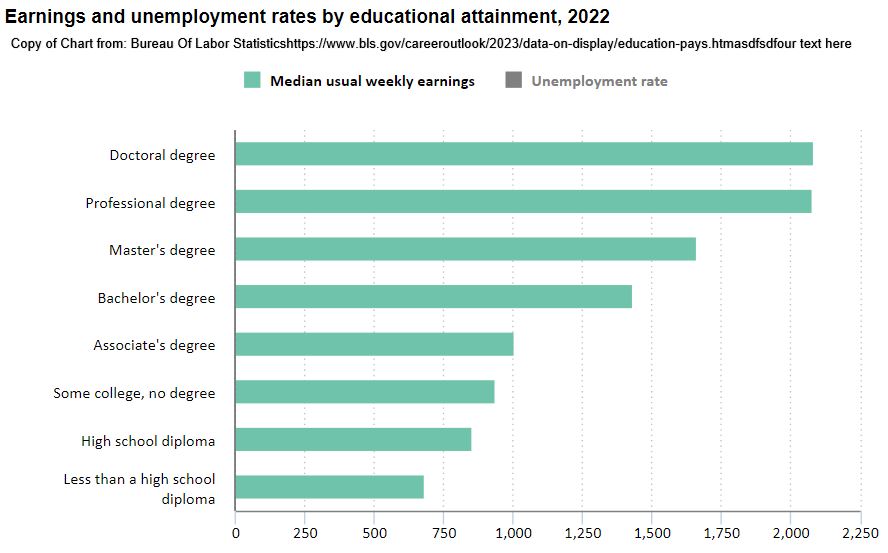
In the BLS Chart shown in Schematic_3.1 , you can see how people with four year college (or higher) degrees have better weekly earnings than people with Associates Degrees, High School Diplomas or less than High School Diplomas.
Schematic 3.1: Bureau of Labor Statistics Education Pays Chart 2022
Demand: Enrollment
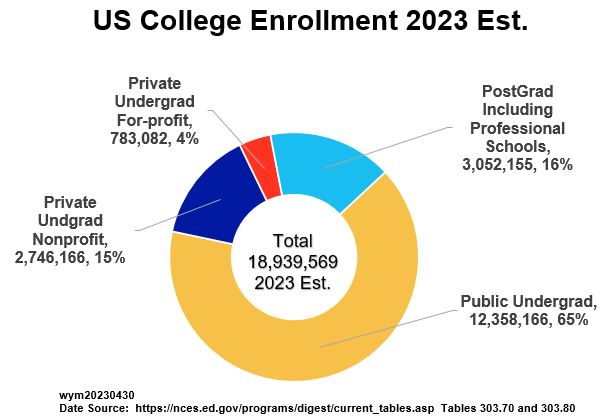
See Schematics_3.2 and 3.3 below for US college enrollment data. These charts were generated from the data available at the National Center for Education Statistics
Schematic 3.2: US College Enrollment 2023 Estimated (18.9 Million)
Schematic 3.3: Historical US College Enrollment (Peaked in 2010 at 21 Million)
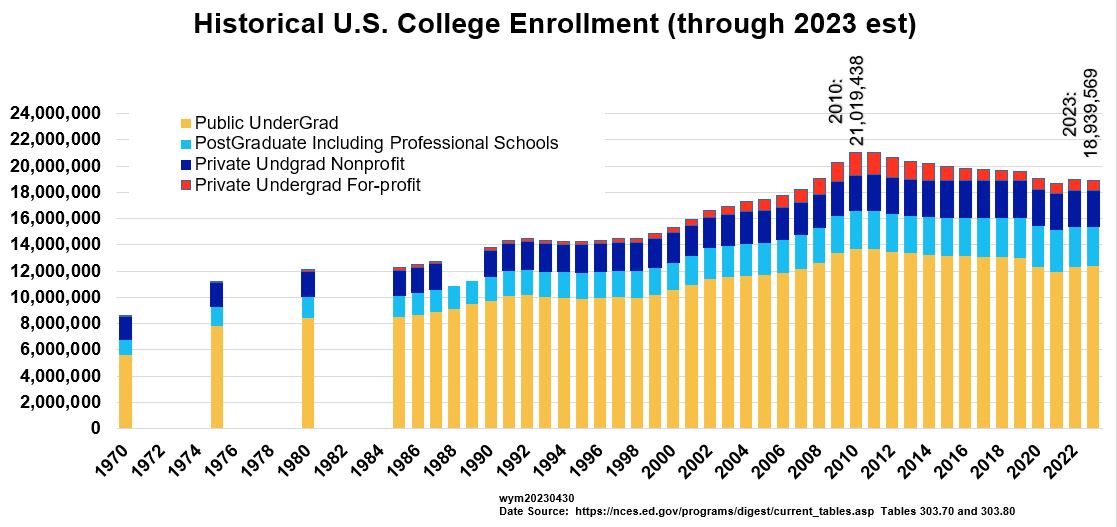
Notice there was a steady increase in enrollment until about 2010. Total Enrollment has been dropping since 2010. Some of the reasons for this are:
- The Great Recession of 2007 – 2009 and the Covid Pandemic 2019-2022
- Decline in Youth Population (See : Looming Enrollment Cliff)
- Poor performance of many private for-profit Institutions. (some of the reasons for this are: low graduation rates, poor job placement, tarnished reputation due to malfeasance and resultant governmental investigations etc.; see : For Profit College System is Broken)
- Belief (due to the above) that college education is not worth the price
Supply
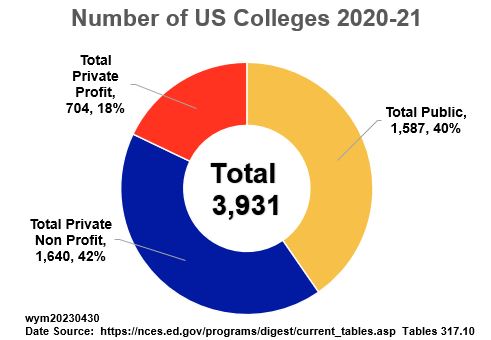
According to the National Center for Education Statistics ,NCES, at the end of 2020, there were about 3,931 (2 and 4 year) public and private colleges in the US. About 42% percent are private non-profit institutions and about 40% are public universities. The remaining 18% are private for-profit institutions: These are owned and operated by private groups (e.g. Devry, Strayer, Univ. Of Phoenix etc.).
Schematic 3.4: Number of US Colleges 2020-21 (3,931 total)
Schematics_3.5 and 3.6 chart historical enrollment and number of colleges. Some interesting patterns appear in these charts.
Schematic 3.5: Historical US College Enrollment (Number of Public and Non-Profit Private Colleges are Flat)
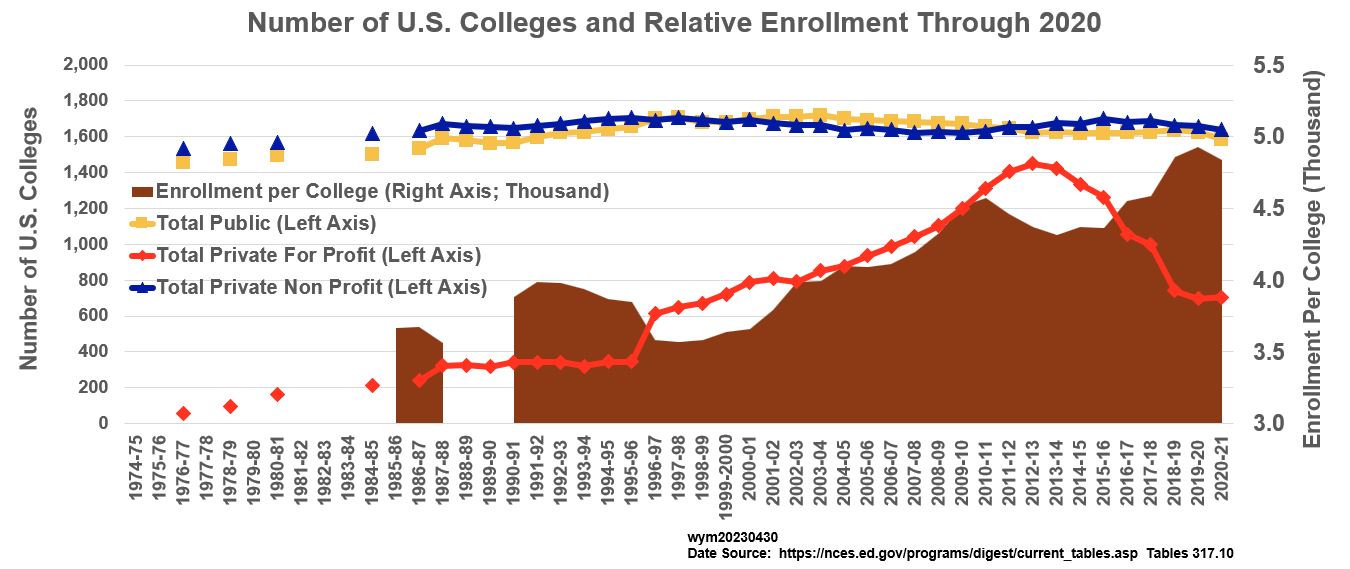
The enrollment data points in Schematic_3.5 (and 3.6) are expressed as the ratios of the total enrollment / number of colleges. You can see that the number of traditional public and private (non-profit) institutions have remained roughly constant. But look at the trend of the number of private for-profit colleges (the red line). These have increased a lot over the years. As noted earlier, they “blew up” due to the Great Recession and bad performance (bad graduation rates, lots of government scrutiny and lots of bankruptcies).
But notice the brown area curve in Schematic_3.5. This enrollment/number of colleges ratio dipped starting in 2012 ,but it has gone right back up (suggesting overall demand is still high, regardless of the drop in the for-profits.)
Schematic_3.6 is a variation of Schematic_3.5 where the stacked bars show the college number totals. The enrollment/number of colleges ratio is shown as the brown dot trend. Again, the most recent value is a little off the highest value.
Schematic 3.6: Historical US College Enrollment (Number of Public and Non-Profit-Private Colleges are Flat)
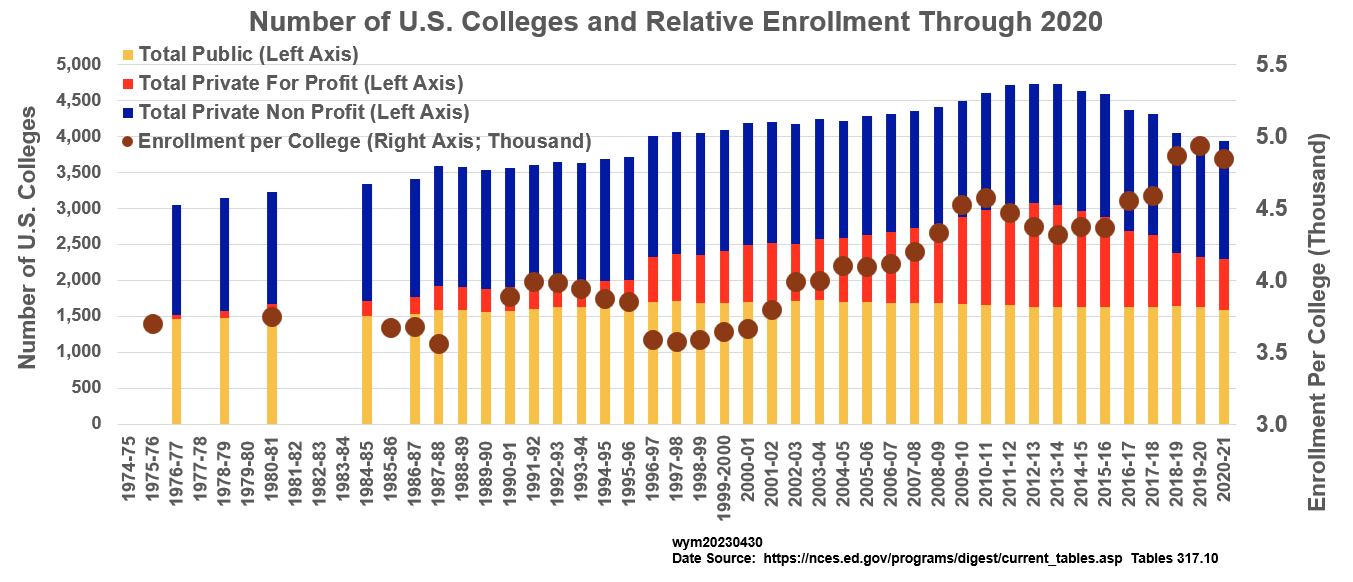
So, the charts above tell me that demand is very strong and allows the current operators to keep the costs high.
2. Marketing: Selling exclusivity
I’ll call this the “country club” effect. Some people (enough people for sure) will pay more for status, bragging rights, and extra services. Some suggest that Ivy League schools among other high tuition schools pander to exclusivity (as enrollment rates at many elite schools have hardly increased through the years. Read this: Why Don’t Elite Colleges Expand Supply?)
3. Less Public School Funding
Public Colleges are receiving less money from state governments. This is a long term trend. Read this: 2016 Center on Budget & Policy Priorities Funding Down, Tuition Up
4. More College Services
To attract students colleges are spending heavily on new campus facilities and student services (dorms, food service, gyms, other facilities, counseling and healthcare services). Have you been on your average campus recently? Things have gotten very fancy. I can see how administrative university costs would increase given these additional services. Read this: 2019 The Cost of Excess – College Runaway Spending
5. Faculty Costs
Some claim that increasing costs of faculty have contributed to increased college costs but looking at the data from NCES, I don’t see significant growth here (relative to general inflation). For example, from 1990 to 2021, using the NCES data, I compute a compounded annual growth rate of 2.5%.
The data might look different for elite colleges though. There are several articles out there describing how educational teaching jobs don’t tend to improve productivity-wise but tend to increase in cost to keep up with equivalent paying jobs in higher productivity fields (otherwise people would go to the higher paying jobs). This is sometimes called the Baumol Effect or Baumol’s Cost Disease. Again it’s not super clear to me how significant a contributor this has been to overall college costs.
6. Federal loans
In additional to being non taxable enterprises (watch this Stossel Video freeloader-u and read 2020 Stossel Reason.com how-elite-colleges-rip-off-taxpayers), colleges (many claim) are massively benefiting from Federally funded student loans.
This one is a very controversial topic as there seem to be as many articles supporting it as there are discounting it.
In February 18, 1987 then Secretary of Education William Bennett published an influential article titled “Our Greedy Colleges“. In it Bennett claims that financial aid has enabled (not necessarily caused) the rates of tuition increases to be higher than the inflation rate. There have been numerous studies trying to confirm or disprove this theory.
The “Bennett Hypothesis” goes something like this: Loans are available to students regardless of need (i.e. students are not vetted like with a normal loan). Parent and Graduate PLUS loans are easy to get as well. The universities know this so increase the cost to, in essence, capture some of this government assistance. The universities get paid up front so there is no great incentive to ensure those students graduate.
Readings:
- 2022 NationalReview.com why-college-still-costs-too-much
- 2022 Mciverinstitute.com the-real-reason-for-the-student-loan-crisis-government
- 2022 Causes and Solutions-to-the-student-debt-crisis
- 2022 RichmondFed.org Do Student Loans Drive Up College Tuition?
- 2021 Medium Why College Is Too Expensive
- 2019 Why College Tuition Is so Expensive?
- 2019 Berkley Economic Review our-greedy-colleges-revisited
- 2017 Martin Center The Bennett Hypothesis Turns 30
- 2017 NY Fed Credit Supply and the Rise in College Tuition
- 2016 NBER Accounting for Rise in College Tuition
- 2015 Downsizinggovernment.org : Higher Education Subsidies
- 2014 Relationship between Fed Student Aid & Increases in College Prices
Student Debt
Ok, let’s dig into Federal Student Debt a little more. In this section I’ve created some graphs using data from the following two resources:
- Household Debt and Credit Information from the New York Federal Reserve
- Office of Federal Student Aid
Federal Student Debt tracked by the Office of Federal Student Aid comprise three categories:
- Direct Loans are loans made directly by the U.S. Department of Education
- Federal Family Education Loans (FFEL) are loans that were originally funded by private companies (but are now Federally backed).
- Perkins Loans were subsidized loans (the government payed the loan’s interest while student was in school). Perkins loans are no longer available to students.
Based on the Federal Student Aid Portfolio Summary Table for Q2 2023,
- Direct Loans amount to $1.446 Trillion or 87.93% of total federal student aid.
- FFEL (Federal Family Education Loans) amount to $194.7 Billion or 11.84%.
- Perkins loans amount to $3.7 Billion or .23%.
- Total Federal Student Loan Amount = $1.644 Trillion (does NOT include Private Student debt).
- According to the Federal Reserve G19 report , Total Federal + Private Student Debt in Q2 2023 was about $1.774 Trillion. So, if we assume that the same estimation basis was used, Private Debt adds an additional $130 Billion to the Federal only total.
- Remember that 1 Trillion is 1 with 12 zeros after it (it’s a F.B. number).
Let’s get some perspective on the Federal Student Debt by looking at overall Household Debt (See Schematic_4.1 below).
Schematic 4.1: Household Debt Q1 2023 Snapshot ($17.05 Trillion)
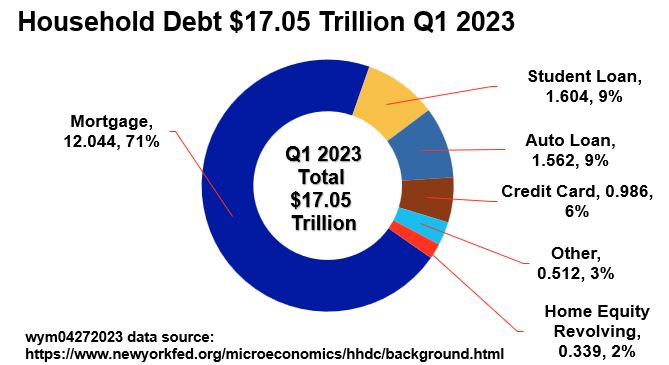
Note: New York Fed Data only includes Federal Student Debt (Private Debt not included)
Federal Student Debt is counted and tracked as part of what is called Household Debt. Household Debt is basically private consumer debt made up of Mortgages, Student Loans, Auto Loans, Credit Card Loans, Home Equity Loans and other.
Schematic 4.1 shows a snapshot estimate of Household debt as of Q1 2023. Mortgages represent about 71% of the total Household Debt ($12 Trillion!). Using a US Q1 2023 US GDP (Gross Domestic Product) of $26.53 Trillion, Mortgage Debt is ~45% of the total US GDP. You can imagine how a “housing crisis” could destabilize the US economy (as it has in the past).
We’ll put aside the very interesting (terrifying) topic of the total US Debt and save that for another article. Let’s focus on the Federal Student debt. It’s about 9% of total Household Debt and comes in second behind Mortgages. A close third is Auto Debt.
Please note that the New York Federal Reserve data does not include Private Student Debt whereas the Federal Reserve G19 report does (rough difference is about $120 Billion for Q2 2023).
Schematic_4.2 below shows historical Household Debt using a line_area chart. Mortgage Debt and Total Household Debt values should be read off the right axis. Notice that
- Student Debt growth has been consistently upward sloping (slowed in recent years due to the Great Recession and Covid).
- Only Student Debt, Auto Loan Debt and Mortgage Debt have been (substantially) rising in recent years.
- The shape of the Mortgage Debt line can be explained by the Subprime Mortgage Crisis of 2007–10. Mortgage Debt levels peaked in Q3 2008 and broke through these pervious highs in Q2 2019 (11 years later).
Schematic 4.2: Historical Household Debt Through Q1 2023 (Only Federal Student Debt Counted)
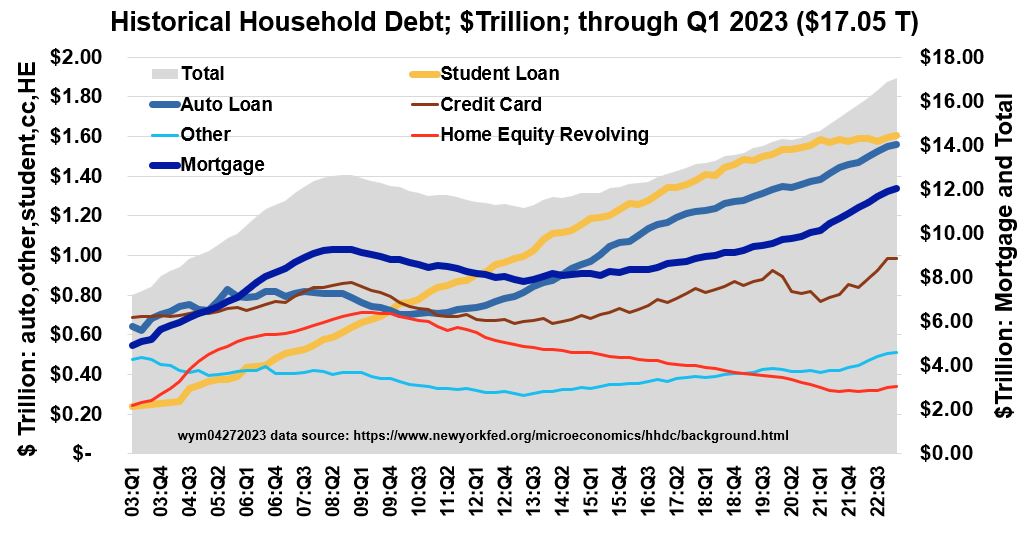
Note: New York Fed Data only includes Federal Student Debt (Private Debt not included)
Schematics_4.3 and 4.4 below are the same pie and area charts as above, except that we’ve removed the Mortgage numbers.
Schematic 4.3: Household Debt Excluding Mortgages Q1 2023 Snapshot ($5 Trillion)
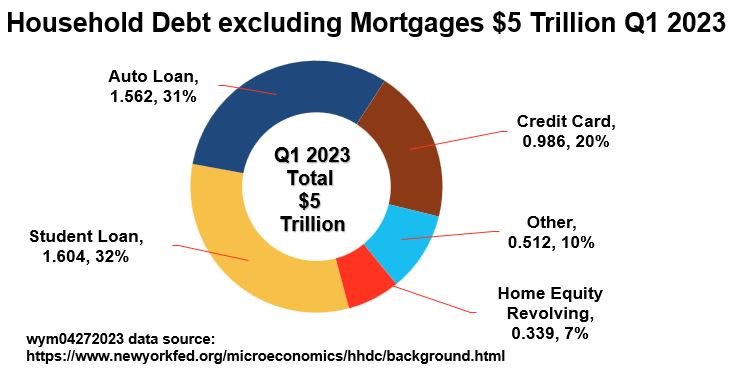
Note: New York Fed Data only includes Federal Student Debt (Private Debt not included)
Not including Mortgage Debt, Federal Student Loans and Auto loans make up about 32% and 31% of the remaining $5 Trillion household debt.
Schematic_4.4 is the same as Schematic_4.2 except Mortgage Debt is not included. We see that Student and Auto Debt have steadily increased since ~2010/11.
Schematic 4.4: Historical Household Debt Excluding Mortgages Q1 2023 ($5 Trillion)
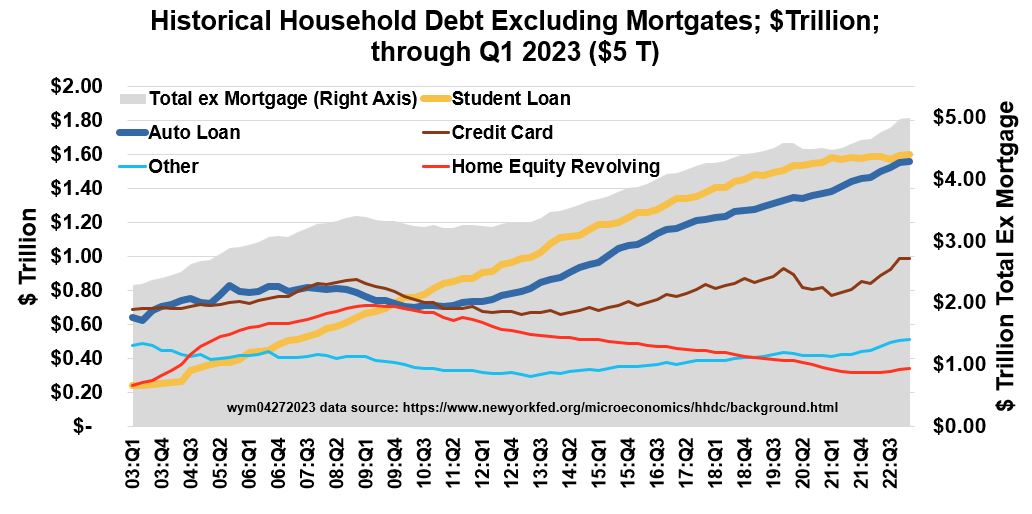
Note: New York Fed Data only includes Federal Student Debt (Private Debt not included)
Student Debt Characteristics
Schematic_4.5 below was generated using data from the Federal Student Aid Portfolio Summary. According to data from this source:
- Total Federal Debt as of Q2 2023 is $1.64 Trillion
- The Federal Student Debt per borrower is $37,718 (double the value from 2007)
Schematic 4.5: Historical Federal Student Debt Through Q1 2023 ($1.64 Trillion)
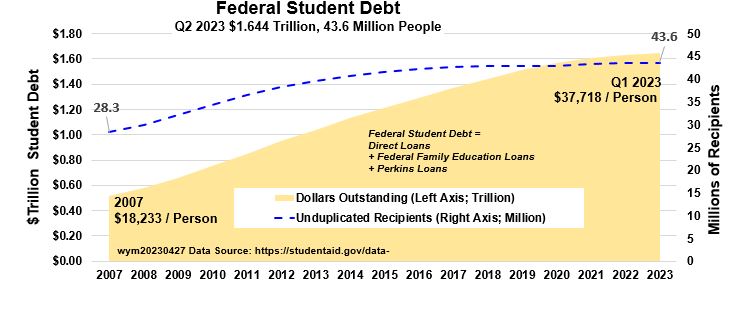
Note: The Federal Student Debt values don’t include Private Student Debt.
Schematic_4.6 shows information on Federal Direct Loans through Q2 2023. Note that after Q1 2020, Provisions in the CARES ACT as well as administration executive actions have caused large shifts in categorization. So, I don’t think the data can be reasonably interpreted after Q1 2020. I don’t believe there is any real substantial reason for the default line (with grey dots) to begin dropping.
The government is interfering and trying to figure out ways to relieve what they know is a big problem with debt holders being unable (or finding it very difficult) to pay back their loans.
Schematic 4.6: Historical Federal Direct Student Loan Portfolio Through Q2 2023
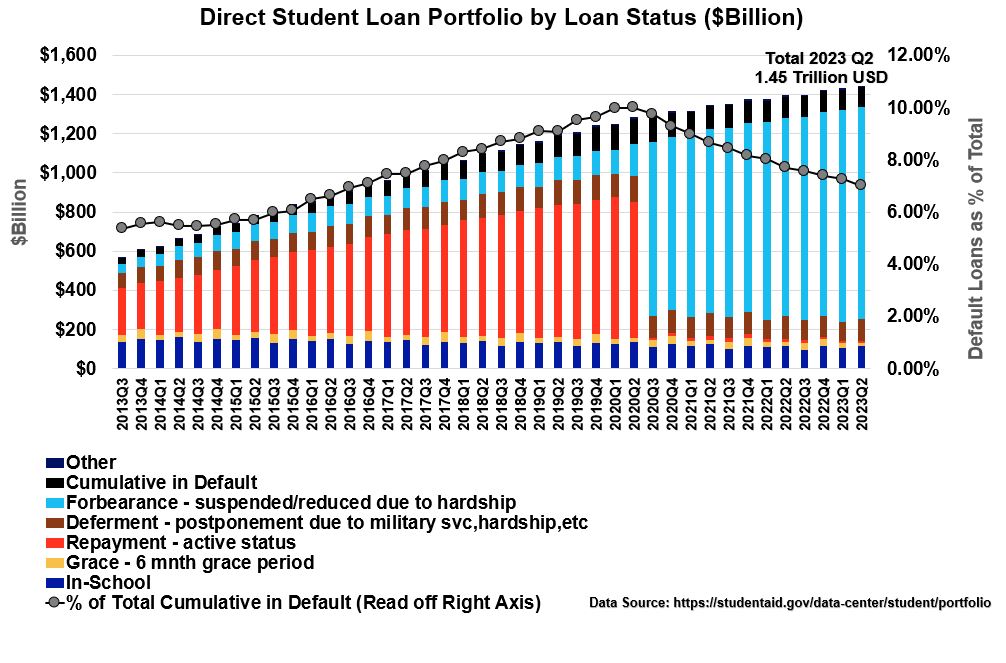
Note: The Federal Student Debt values don’t include Private Student Debt.
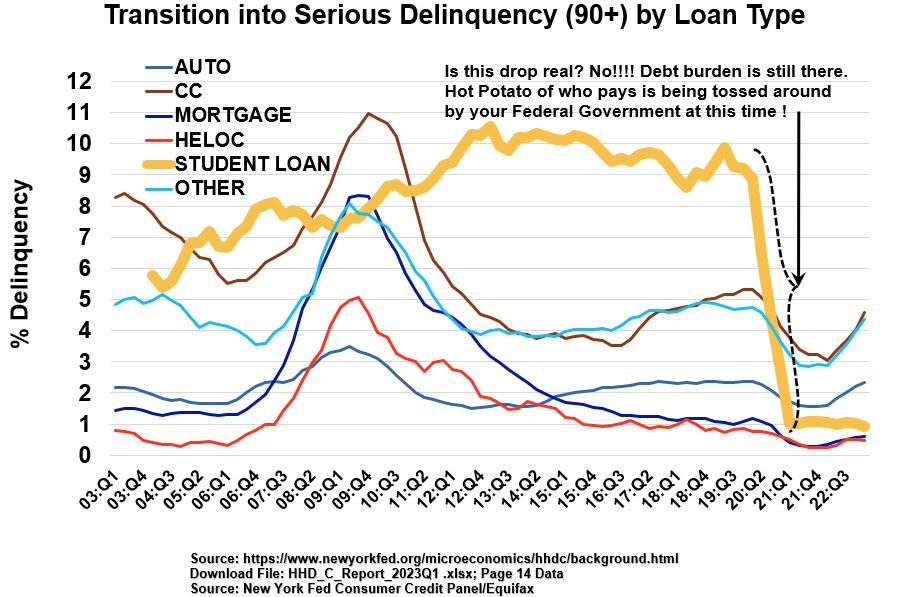
Look at Schematic_4.7 below, which I created from another set of data (from the ‘page 14 data’ sheet of the excel download from the New York Fed microeconomics page).
Delinquency rates for Student Debt are much higher than other consumer debts. Again, ignore the recent precipitous drop. If it’s real, it just means the government has to figure out a way to recover those delinquency costs (can you guess what they’ll probably try to do?).
Schematic 4.7: Consumer Debt Delinquency Rates (New York Fed Data)
Here are a few other sobering statistics for you (based on this article by the Austin American Statesman and other references listed below):
- Based on data from the National Center for Education Statistics, a review of borrowers who started college in 2012, shows that only 40% (i.e. 60% didn’t) had a bachelors degree 6 years later (39% had no degree at all with the others having associate degrees or certificates).
- Note: The above study might not be fully representative and a little misleading because it only looks at 2012 freshman. In addition, undergraduate college completion rates are often longer than 4 (5? or 6?) years (this is kind of a problem in itself isn’t it?). Also, Graduate school borrowers are not included in the statistic.
- A 2019 Federal Reserve Survey of Consumer Finances showed that 43% of households who had education debt did not have a college degree.
- To summarize…Houston, we have a problem. There are probably many people who are holding debt that might not have the capacity to earn enough to pay back loans in a timely manner.
- Other References: (a) 2022 Verification that 40% of debt owners dont graduate (b) 2021 Almost 40% of borrowers with student loan debt didn’t finish their degree in 6 years (c) 2019 Why College Tuition is So Expensive.
Summary
So, to summarize, the data above tells us that:
- As of Q2 2023, outstanding Federal Student Debt is about $1.64 Trillion (with an additional ~.134 Trillion of Private Student Debt).
- After Mortgage Debt, Student Debt is the highest consumer debt (Auto Loan Debt is a close third).
- Student Debt growth over the years has shown the steepest trajectory upwards. (compared to the other consumer debts).
- Student Debt delinquency rates are much higher than the other consumer loans.
- Some studies show that a large percent of education debt belongs to people without degrees.
Ok, we now know a little more about the state of education cost and debt. Let’s switch gears and describe how you can use the education funding calculator embedded in this article.
Funding Calculator Examples
Let’s go through 3 examples of how to use the embedded Education Funding Calculator.
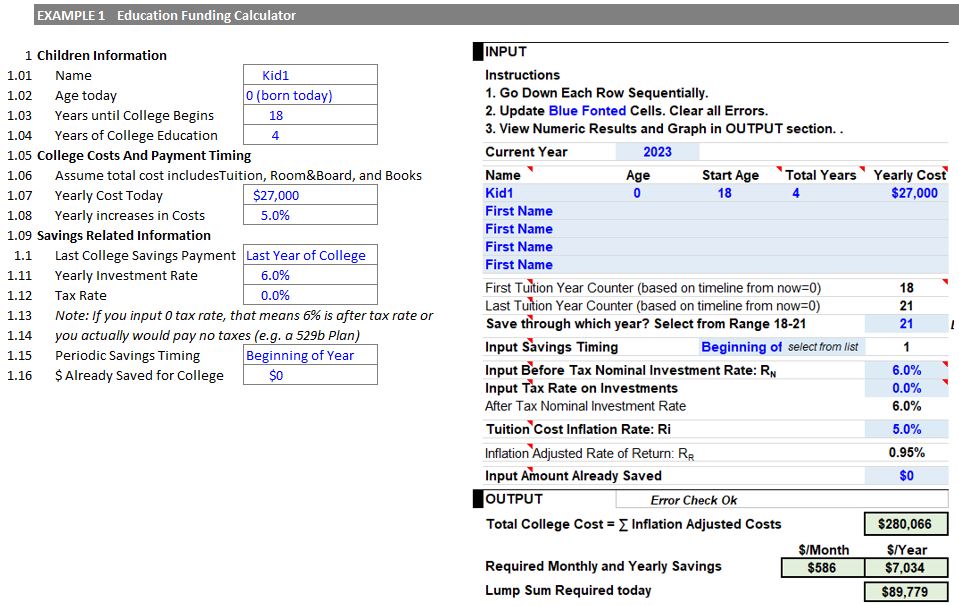
Example 1 One Child Born Today (no current savings)
- You have 1 child born today.
- She will attend college when she is 18.
- It will take her four years to finish.
- Today’s yearly cost for college is assumed to be $27,000.
- The cost of college will increase 5% each year.
- Assume you will save until the last year of college.
- Assume your yearly investment rate return is 6%.
- The tax rate is 0% (it’s in a 529 B college savings plan). Note that we could set this as zero percent also if we assume our yearly investment rate of return is an after tax return.
- Savings will occur at the beginning of the year.
- Assume you have no current savings for college.
Enter these values into the INPUT section of the calculator.
Results (see the OUTPUT section of the calculator)
- Total inflation adjusted education cost will be $280,066.
- Required Yearly savings are $7,034/yr ($586/mo).
- The single value lump sum required today to pay for this will be $89,779.
Schematic 7.1 : Education Cost Funding Calculator Example 1
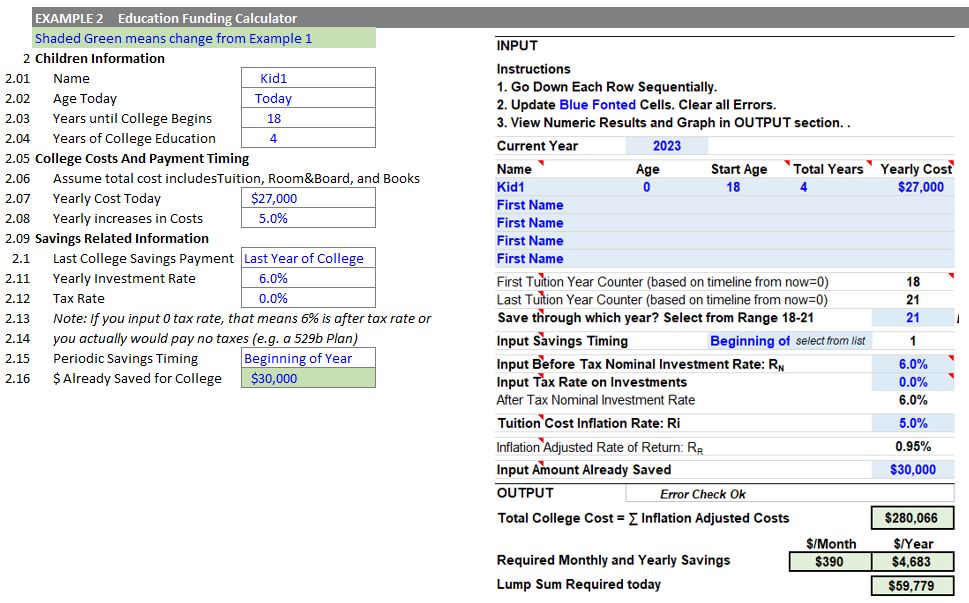
Example 2 One Child Born Today (with current savings)
- You have 1 child born today.
- She will attend college when she is 18.
- It will take her four years to finish.
- Today’s yearly cost for college is assumed to be $27,000.
- Assume the cost of college will increase 5% each year.
- You will save until the last year of college.
- Assume your yearly investment rate of return is 6%.
- Assume tax rate is 0% (it’s in a 529 B college savings plan). Note that we could set this as zero percent also if we assume our yearly investment rate of return is an after tax return.
- Savings will occur at the beginning of the year.
- Assume you have current savings for college for $30,000.
Enter these values into the INPUT section of the calculator.
Results (see the OUTPUT section of the calculator)
- Total inflation adjusted education cost will be $280,066.
- Required Yearly savings are $4,683/yr ($390/mo).
- The single value lump sum required today to pay for this will be $59,779.
Schematic 7.2: Education Cost Funding Calculator Example 2
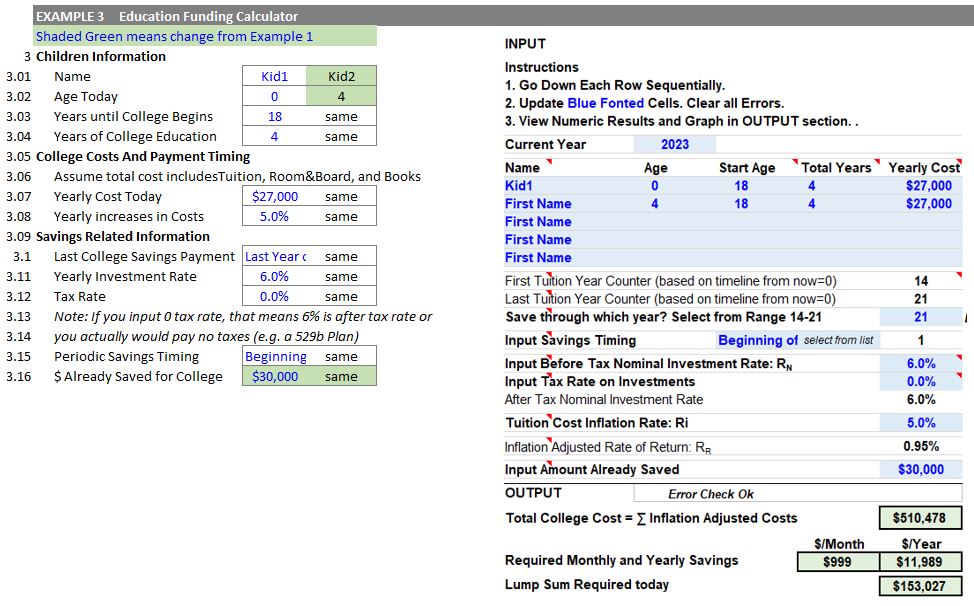
Example 3: 2 Kids (with current savings)
- You have 1 child born today.
- You have a child who is 4 years old.
- They will both attend college when they are 18.
- It will take them four years to finish.
- Today’s yearly cost for college is assumed to be $27,000 (for both kids).
- Assume the cost of colleges will increase 5% each year.
- Assume you will save until the last year of college.
- Your yearly investment rate of return is 6%.
- Assume tax rate is 0% (it’s in a 529 B college savings plan). Note that we could set this as zero percent also if we assume our yearly investment rate of return is an after tax return.
- Savings will occur at the beginning of the year.
- Assume you have current savings for college for $30,000.
Enter these values into the INPUT section of the calculator.
Results (see the OUTPUT section of the calculator)
- Total inflation adjusted education cost will be $510,478.
- Required Yearly savings are $11,989/yr ($999/mo).
- The single value lump sum required today to pay for this will be $153,027.
Schematic 7.3: Education Cost Funding Calculator Example 3