A Trillion is a Gargantuan Amount
Let’s start with an example of a big number issue.
The US government spends a Metric Shit-Tonne (MST) of money. In my working days, my colleagues and I frequently used this funny but effective term to describe really big things. MST in this case means “in the trillions”. But, seriously, how big is a trillion (or a billion) and why should you care?
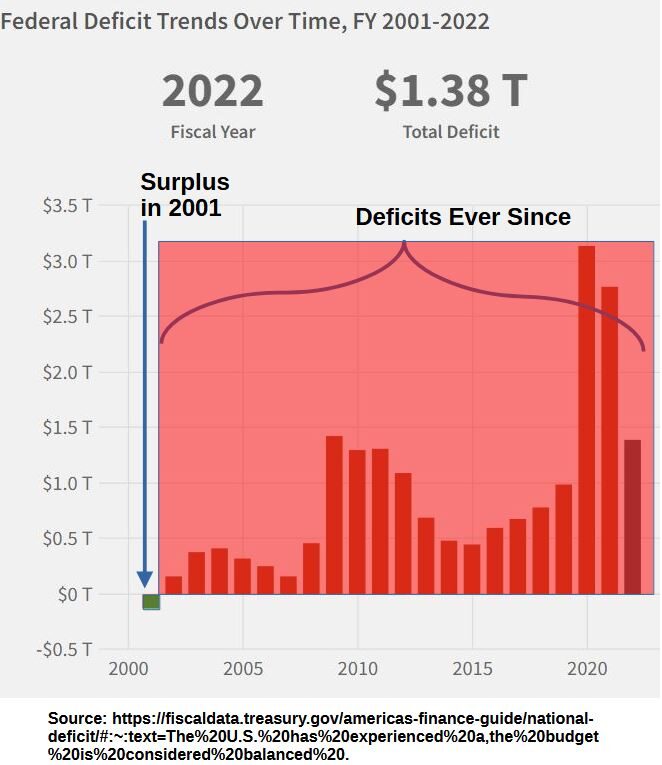
Government takes money in (Tax Receipts) and then spends it (Outlays). Subtract Outlays from Receipts and you get a Surplus (almost never in recent history) or a Deficit (almost always in recent history). Graph 1.1 shows you how the US Government regularly overspends (it’s not the only one). Last time the US Government had a Surplus was in 2001 (the first bar in Graph 1.1), so insert your favorite four letter expletive here and ponder this a little bit. Those numbers are in trillions of US dollars. A trillion is a thousand billion! If you wrote out 1 trillion, it would look like this: 1,000,000,000,000
Graph 1.1 – Historical USA Federal Deficit in $ Trillions through Sept 30, 2022.
When the government overspends, it has to borrow money. It does this by issuing bonds to the public (domestically and internationally).
Year after year, the deficits cumulatively add up to what is called the National or Public Debt. As of 4Q 2022, the US National Debt stood at $31.42 trillion! The US Government, through the years, has spent $31.42 trillion dollars more than it has received from the taxpayer.
$ 31,419,689,000,000 Public Debt
(as of end of 4th Quarter 2022)
At the very least, this should make you sweat a little bit, but you need some context. Indeed, a common theme of this article is that you almost always need to establish some context or basis whenever you try to understand numbers.
If you compared it the population of the USA, then this debt would be 31.4 trillion/340 million = $92,353/US person. We broke down a fairly meaningless number into something more relatable. You want to always do this with extreme numbers.
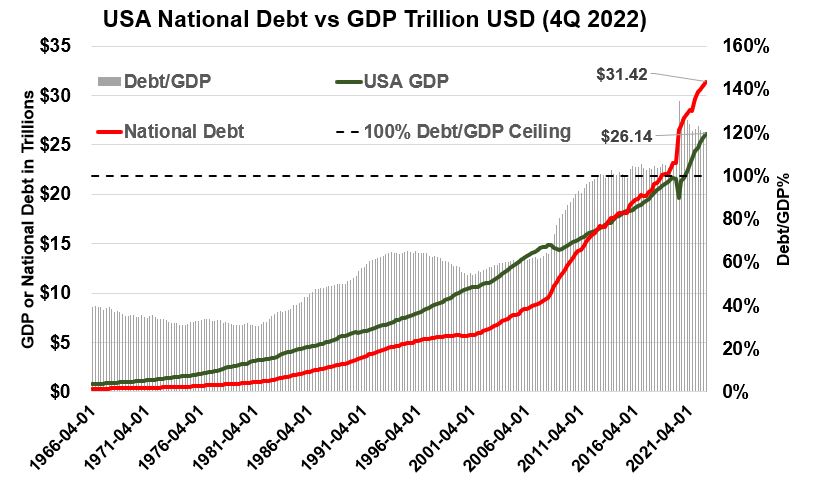
National Debt Compared to the GDP
How does the National Debt compare to the nation’s economic output?
The GDP (Gross Domestic Product) measures the country’s economic output. It’s the yearly dollar value of all final goods and services produced within a country. Refer to my post (Macro-Economics and US Government Economic Policies) for more details on GDP.
Graph 1.2 below plots both GDP and the National Debt over time. You should start sweating a little more now. As of 4Q 2022 , the National Debt exceeds the size of our National Output (GDP) by 1.2x. When you begin to understand the contextual meaning of the number then you can start asking questions like: How did we get here?
Graph 1.2 – Historical USA National Debt Compared to its Gross Domestic Product through 4Q 2022
The following spending events were/are major contributors to the current debt situation.
- After Sept 2001 (Terrorist Attack on America) – Homeland Security and Afghanistan and Iraq Wars
- Recession 2007 to 2009 ( housing bubble, bank bailouts) – Quantitative Easing starts in 2008
- Quantitative Easing cash injections into Economy continue into 2014
- Covid 19 March 2020 Quantitative Easing and CARES (Coronavirus Aid, Relief, and Economic Security) Act.
- 2021 American Rescue Plan Act (COVID-19 Stimulus Package)
- 2022 Inflation Reduction Act
We have all heard that the government can just print more money so they should not be held to the same budgeting rules you are hopefully teaching your kids! The issue is very complicated, but many experts know this kind of mad spending is not sustainable.
The Meter Stick
It does not take a very high number to force most humans to switch from absolutely understanding numbers (on an instantaneous, instinctual level) to having to use analogies and comparisons.
For example, if you are in a room with 10 people, you are not going to immediately know there are 10 in the room without actually counting them. But, you probably will have an immediate rough idea. This is because you can relate it to quantities familiar to you (class room size for example). The ability to comprehend numbers on a relative basis (i.e. using a reference point) expands our intuitive (practical) understanding of what the numbers actually mean.
A really good reference point is a meter measuring stick which has a length of about 3.28 feet (1.09 yards).
Schematic 4.1 – Meter Stick
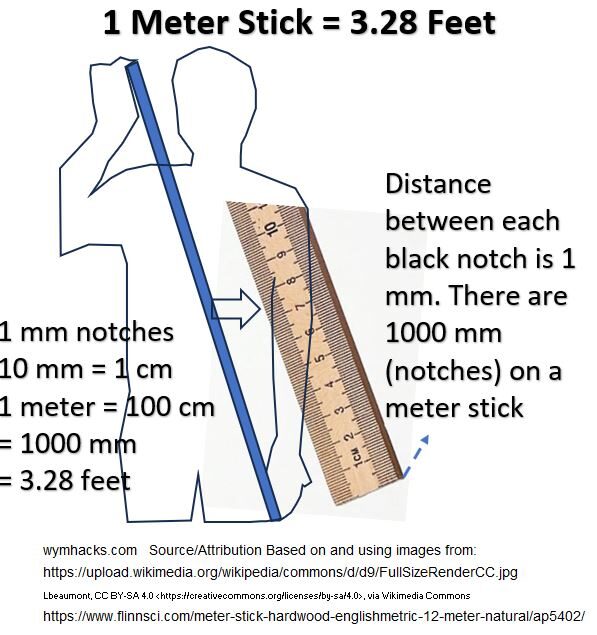
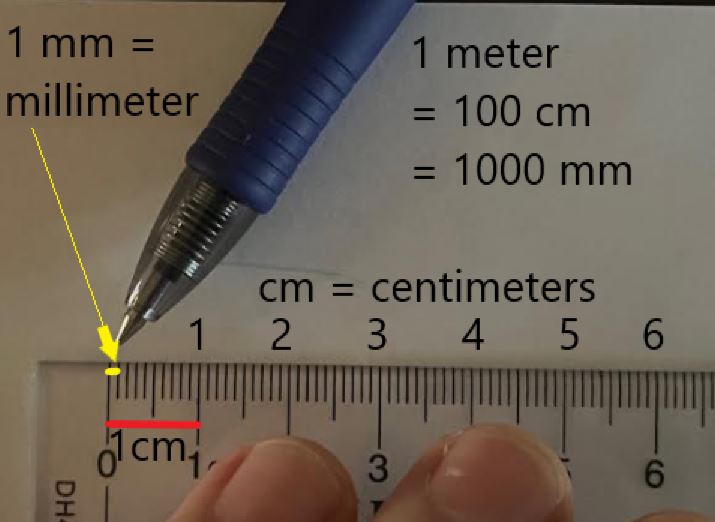
Notice that a meter stick has lots of black markings (notches). The distance between each of these markings is 1 millimeter or 1 mm, and there are 1 thousand of these on a 1 meter stick. Every 10 millimeters add up to 1 centimeter, and meter sticks typically have the centimeter values denoted from 1 to 100. So, we see that 1 meter = 100 cm = 1000 mm.
Take a look at the magnified view in Schematic 4.2 below. The tiny yellow line marks a 1 mm distance. A medium ball point pen will have a pen ball diameter of about 1 mm. The smallest dot you can probably see with your bare eyes is around .1 mm (one tenth of a millimeter).
Schematic 4.2 – Meter Stick (1 m = 100 cm = 1000 mm)
So ,if we want to establish a length reference point , the meter stick is very useful because it gives us a visual, spatial idea of what “1000x (times) more or bigger means”. e.g. A million is a 1000x bigger than a 1000, and a billion is 1000x bigger than a million, and a trillion is 1000x bigger than a billion.
We want to apply this visual tool to large (and small) numbers, but first let’s define some useful numeric notation.
Notation
- Let NEn = N x 10n where N is any number, x is the multiplication symbol, and n indicates a power of 10 and can be negative, zero, or positive
- Example 1: 2.2E3 = 2,200
- Example 2: 1E5 = 100,000 = 100 thousand
- Example 3: 1.345E9 = 1,345,000,000 = 1.345 billion
- Example 4: 400E4 = 4,000,000 = 4 million
- Example 5: 4E6 = 4,000,000 = 4 million
- Example 6: 34E12 = 34,000,000,000,000 = 34 trillion
- Example 7: 225E-3 = .225 (milli is a prefix equal to E-3, so 225 millimeters = .225 meters)
- Example 8: 225E-2 = 2.25 (centi is a prefix equal to E-2, so 225 centimeters = 2.25 meters)
- Example 9: 200E-12 = .000000000200 = 200 pico units (e.g. picometer)
- Example 10: 5E0 = 1 or more generally NE0 = 1 where N is any number
Observe that
- The power of 10 value indicates the number of digits the decimal must be moved to the right (positive power) or left (negative power) to display the number without any power notation. So, in the above Example 4 (400.0E4 = 4,000,000), the decimal is moved to the right 4 digits where the empty spaces are filled with zeros. And in Example 7 (225.0E-2=.225) , the decimal moves 3 places to the left; from after the “5” to before the first “2”.
- We used several useful prefixes and commonly used terms (million, billion, trillion, centi, milli, and pico). Go to Appendix 2 for a detailed listing of prefixes and other commonly used terms.
Meter Stick as a Reference Point for Large or Small Numbers
The Meter Stick gives us a visual, spatial idea of what “1000x more or bigger means”.
For large numbers (using the meter as our unit of length):
- .001 x 1000 = 1×10-3 x 1000 = 1E-3 x 1000 = 1 millimeter x 1000 = 1 meter (Imagine a 1 meter length stick with distance between any two markings = 1 millimeter)
- 1 x 1,000 = 1,000 = 1E3 = 1×10³ (Imagine the meter stick now represents a 1000 meters where distances between any two notches = 1 meter)
- 1,000 x 1,000= 1 million = 1,000,000 = 1E6 = 1×10⁶ (Imagine the meter stick now represents a million meters where distances between any two notches = 1000 meters).
- 1,000,000 x 1000 = 1 billion = 1,000,000,000 = 1E9 = 1×10⁹ (Imagine the meter stick now represents a billion meters where distances between any two notches = 1 million meters).
- 1,000,000,000 x 1000 = 1 trillion = 1,000,000,000,000 = 1E12 = 1×10¹² (Imagine the meter stick now represents a trillion meters where distances between any two notches = 1 billion meters).
For small numbers (using the meter as our unit of length):
- .000000000001 x 1000 = 1×10-12 x 1000 = 1E-12 x 1000 = 1 picometer x 1000 = .000000001 = 1 nanometer = 1×10⁻⁹ meters = 1E-9 meters (Imagine the meter stick now represents a nanometer where distances between any two notches = 1 picometer).
- .000000001 x 1,000 = 1×10-9 x 1000 = 1E-9 x 1000 = 1 nanometer x 1000 = .000001 = 1 micrometer = 1×10⁻⁶ meters = 1E-6 meters (Imagine the meter stick now represents a micrometer (or micron) where distances between any two notches = 1 nanometer).
- .000001 x 1,000 = 1×10-6 x 1000 = 1E-6 x 1000 = 1 micrometer x 1000 = .001 = 1 millimeter = 1×10⁻³ meters = 1E-3 meters (Imagine the meter stick now represents a millimeter where distances between any two notches = 1 micrometer or micron).
- .001 x 1000 = 1×10-3 x 1000 = 1E-3 x 1000 = 1 millimeter x 1000 = 1 meter (We can use an actual meter stick distances between any two notches = 1 millimeter).
So we see that the meter measuring stick can be used to imagine the scale difference between numbers with different orders of magnitude.
In the next section we’ll see how the dimensions of US paper bills can be used to imagine different quantities.
Stacking Up The Dollars
We can use relative length and other distance parameters (width and height) to get a sense of quantities.
Since 1929, all US currency denominations have had the same dimensions and weight:
- Length: 6.14 inches = 156 mm = millimeters
- Width: 2.61 inches = 66.3 mm
- .0043 inches thick = .11 mm
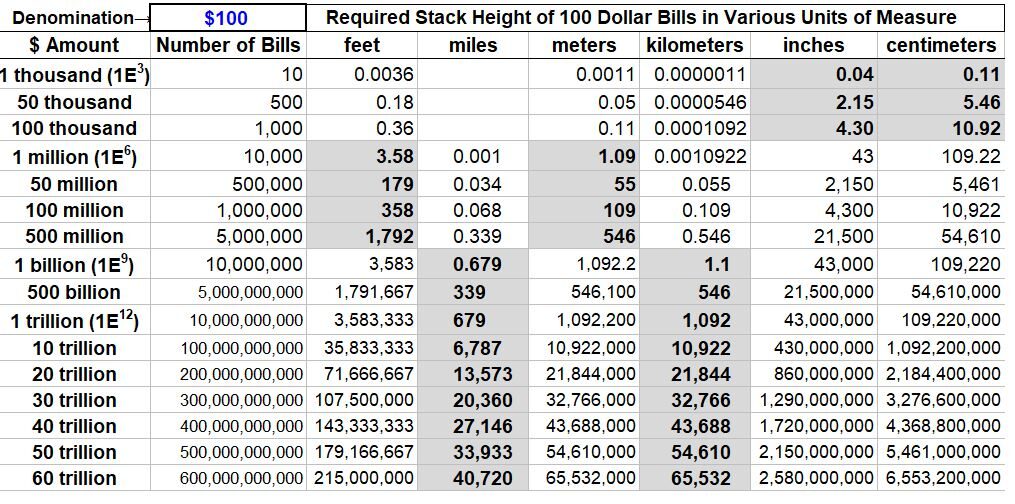
Using the thickness of a 100 dollar bill, I generated the Table shown in Schematic 5.1. It shows the various heights of a stack of $100 bills for various quantities.
Schematic 5.1 – Table Showing Height of Stacked $100 Bills for Various Quantities
So, for example,
- 1 million dollars of $100 bills would stack up to a height of 3.58 feet (1.09 meters). You could stash that in a brief case.
- 1 billion dollars of $100 bills would stack up to a height of .679 miles (1.1 kilometers). This is 1.3 times the height of the tallest building today (Sept 2023: Burj Khalifa at .514 miles = .828 km = 2717 feet = 828 meters).
- 1 trillion dollars of $100 bills would stack up to a height of 679 miles or 1092 kilometers. This height penetrates the Karman Line (62 miles = 100 km above earth) which is where air becomes too thin for conventional aircraft to fly. The International Space Station (ISS) orbits the Earth at about 254 miles so our trillion dollar height is 2.7x the height of the ISS.
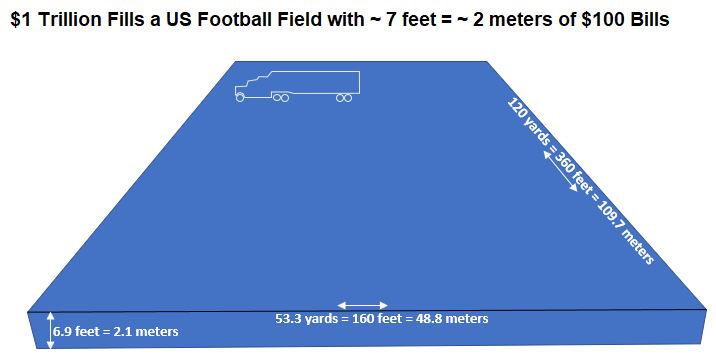
How much space does 1 trillion dollars take up? We can use the dimensions of the US bill to figure this out. If we neatly (no space lost) piled $100 dollar bills on an American Football yield, it will look like Schematic 5.2.
Schematic 5.2 – 1 Trillion $100 Bills on an American Football Field.
Configuring US dollars into various pallet configurations, people have developed some very visually shocking graphics to show you just how much a billion or a trillion dollars are. Check out these graphics by demonocracy.info . See more of my favorite videos/graphics in Appendix 1.
Counting Sand
We can squeeze a lot of sand particles in one handful. Let’s use sand granules to relate to large quantities.
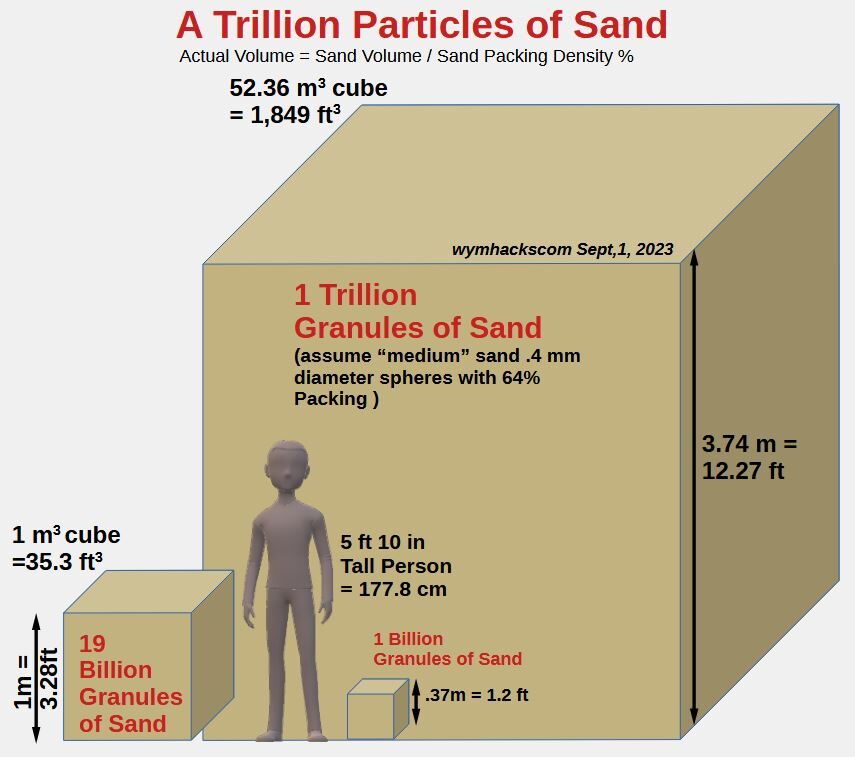
What if you go down to Destin Florida and scoop up some of that fine white beach sand and begin filling cubes of different sizes? Schematic 7.1 shows you the dimensions of three cubes that will hold 1 billion, 19 billion , and 1 trillion granules of sand (I’m making a lot of assumptions here but the order of magnitude is what we are after).
Schematic 7.1 – Cubic Sand Count
Relating Billions and Trillions to Time
We can also use time to get a sense of the magnitude of large numbers.
Schematic 8.1 Large Number vs Time Table
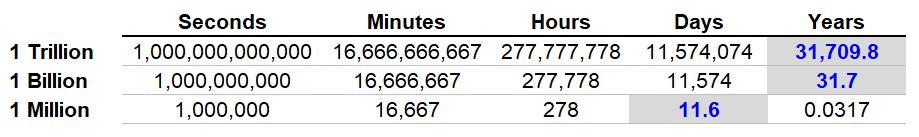
From the table above we can see that
- a million seconds happens in almost two weeks (11.5 days).
- a billion seconds is the life of a 30 year old (31.7 years; ignoring leap years).
- a trillion seconds is 31,710 years (ignoring leap years). If you lived that long ago, you were an Old Stone Age Hunter/Gatherer. The earth was cold and wild animals roamed the lands and you followed these herds for food. The population of the earth probably was just a few million.
How much time do you think it would take to count to 1 million out loud?
If it took just a second per number, it would take about 11.6 days. But it took Jeremy Harper the equivalent of about 59.3 days (he counted for 16 hours a day for 89 days). So, because of the larger numbers, it takes more like 5 seconds on average to count each number from 1 to 1 million.
Astronomically Large Numbers
If we laid out 1 trillion dollars worth of $100 bills side to side (connecting the short sides), how much distance would we cover? Look at Schematic 9.1 and imagine connecting $100 bills in a big daisy chain around the earth’s equator. When you are done you would have gone around the equator almost 39 times (969,066 miles).
To get an absolute sense of millions versus billions versus trillions, we can look at relative distances in our solar system.
Schematic 9.1 – Earth and Moon Dimensions and Distances
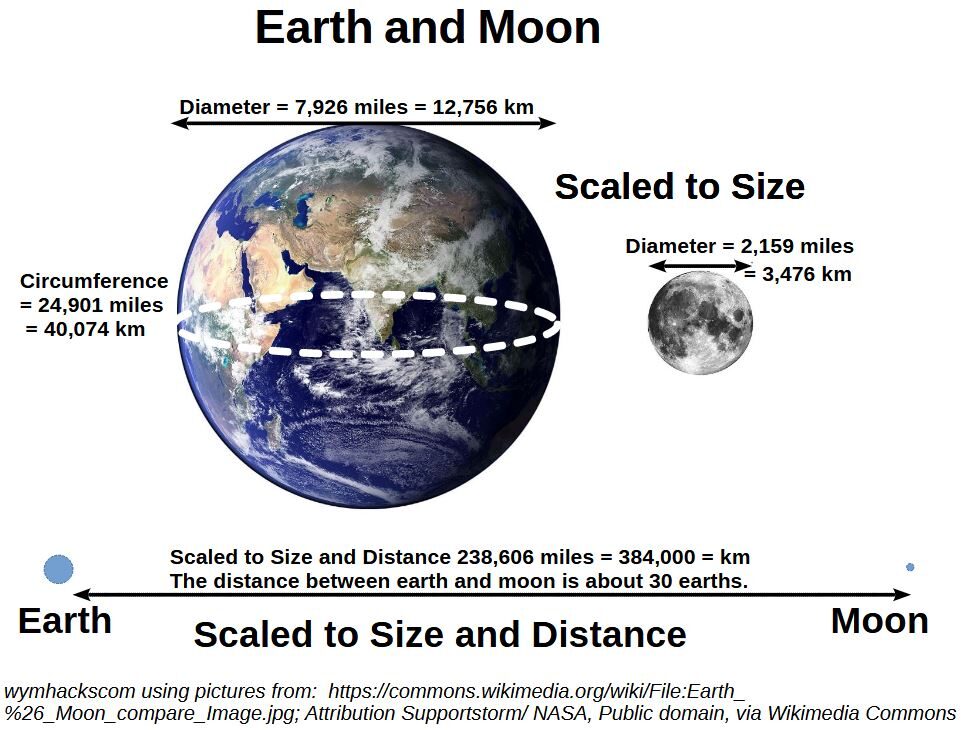
The size of the Earth relative to the Moon is equivalent to a “basketball versus a tennis ball” or a “tennis ball versus a marble”.
- If you were driving at a constant speed of 70 mph in your car, it would take almost 15 days nonstop to drive around the world once.
- If you travelled 1 million miles on earth, you would have gone around the world about 40x. This would take about 83 days for a passenger jet to fly this distance (assuming 500 mph).
- If you went straight out into space , 1 million miles would take you to the moon and back..twice.
Lets go bigger. Look at the amazing Schematic 9.2 below.
Look at our tiny Earth and Moon compared to the Sun and some of the other planets in our solar system! The sizes of the planets are drawn to scale roughly but not the distances. The average distance from the Earth to the Sun is about 93 million miles.
Schematic 9.2 – Solar System in True Imagery , Color, and Size (Distances are not to Scale).
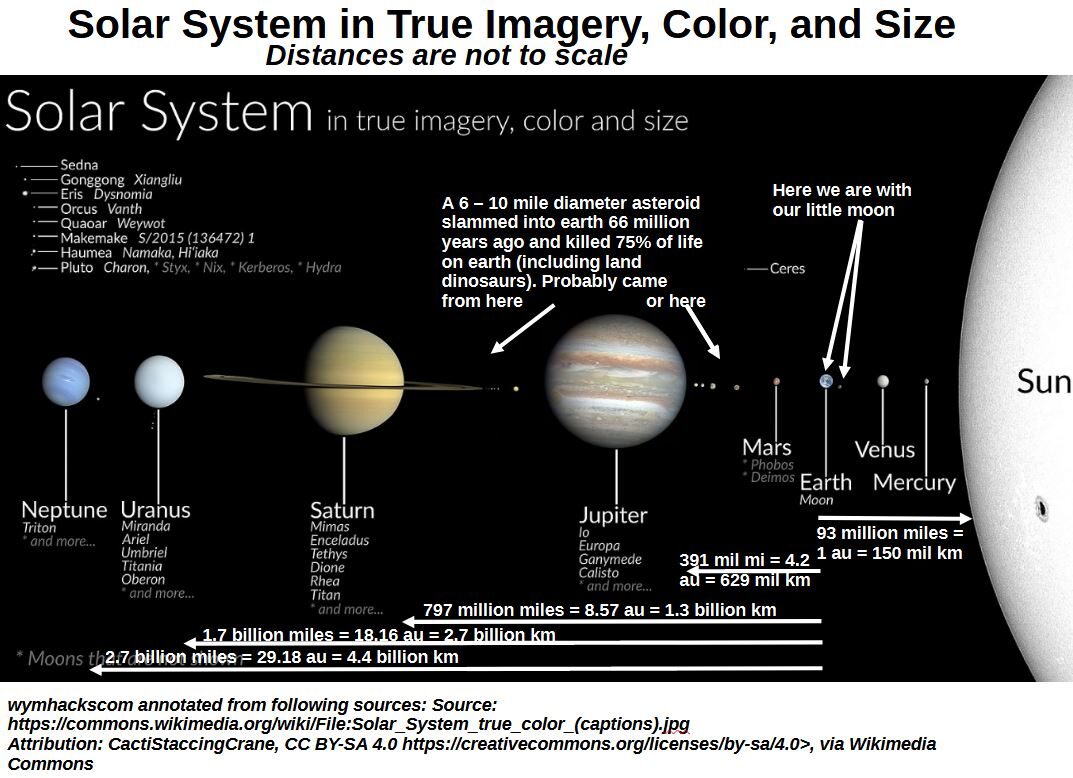
I think Schematic 9.2 is a beautiful thing to look out, but it’s probably more useful to look at a simplified schematic that is scaled to distance
Schematic 9.3 below gives you a better view of relative distances. All those planets bunched up near the Sun are Mercury, Venus, Earth, and Mars.
Astronomers have chosen a convenient distance unit of measure called the astronomical unit or au. A single au is the average distance from the Earth to the Sun which equals about 93 million miles.
Schematic 9.3 – Solar System With Distances to Scale
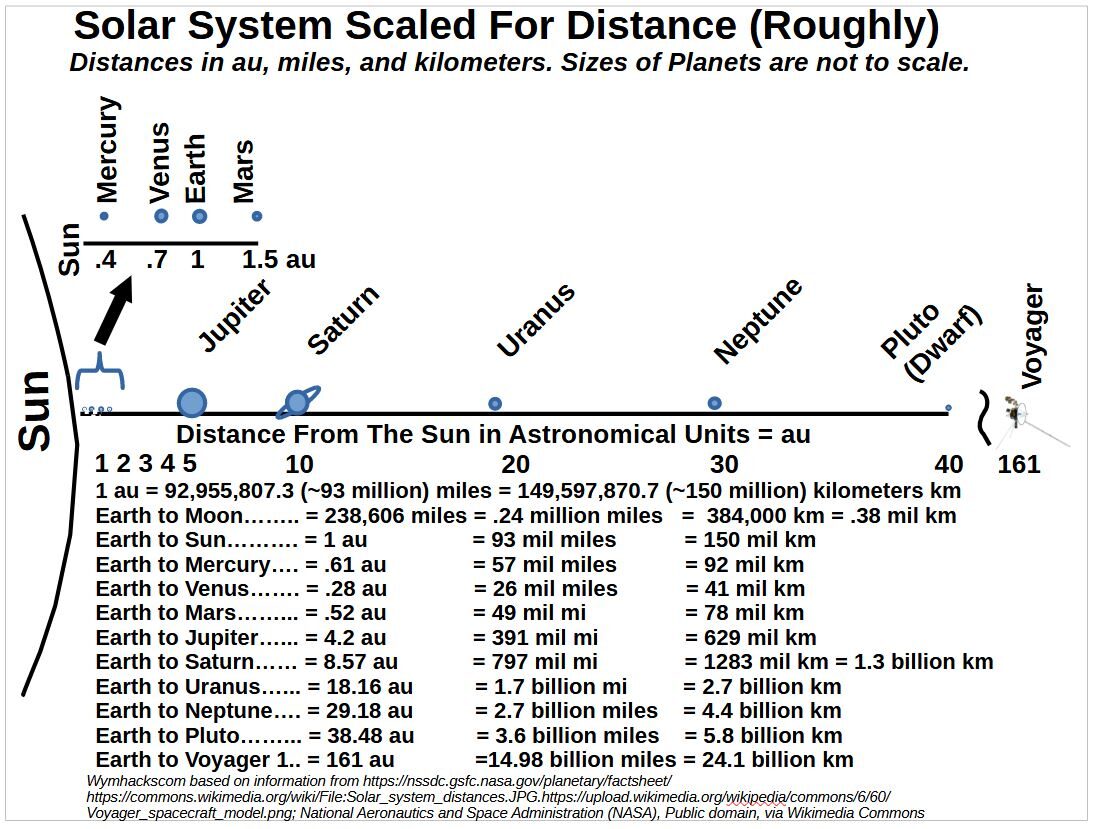
The continuous schematic number line from 1 to 40 au shows the distances of the planets from the sun. The listing of distances given below the drawing are the distances from Earth.
Nasa launched two spacecraft (Voyager 1 and Voyager 2) in the summer of 1977 and these have been travelling in space for 46 years and a few days (as of Sept 12, 2023). Today, on average they travel at 36,ooo miles/hr ! This means they are currently travelling about 3.4 au (about 315 million miles) per year. Today (Sept 12, 2023) they are located beyond our solar system (Interstellar Space).
- Voyager 2 encountered Neptune in 1989 ( 12 years to travel 29 au = 2.4 au/year = 2.7 billion miles)
- Voyager 1 is about 161 au from earth (14.98 billion miles from Earth as of Sept 2023)
- Voyager 2 is about 134 au from earth (12.45 billion miles from Earth as of Sept 2023)
So, astronomical distances in our solar system (from earth) range from
- 100s of thousands of miles (Earth to Moon distance = 238 thousand miles)
- 10s of millions of miles (Earth to Venus, Mars, Mercury, and the Sun)
- 100s of millions of miles (Earth to Jupiter and Saturn)
- billions of miles (Earth to Uranus , Neptune and beyond)
Light Years
Unless you are into (or in) the fields of astronomy/cosmology , a Light Year distance is not something you apply in everyday life. You might be slightly familiar with the term, though, if you’ve seen any of the Toy Story movies (Remember Buzz Lightyear?).
Light travels through space at about 186,000 miles/second. So, snap your fingers and that light has travelled 186,000 miles (7.5x around the Earth’s equator)!
- 5.87 trillion miles/year (1 Light Year is the distance light travels in a year). It would take 62 days for light to travel 1 trillion miles.
- 16.1 billion miles/day
- 482 billion miles/month
- 11.16 million miles/minute. (How long does it take light from the sun to reach earth? 93mil/11.2mil = 8.3; so about 8 minutes)
- Voyager 1 has travelled 14.98 billion miles (as of Sept 2023). This is about .002552 Light Years. Travelling at its current speed , Voyager 1 would take 18,566 years to cover 1 Light Year!!!
A Light Year is about 63,241 au. It’s just another useful measure when dealing with distances way outside our solar system (e.g. Proxima Centauri, the closest known star to the Sun, is about 4.28 Light Years away). When we discuss Galaxies, Light Years become more practical units of distance measure.
Galaxies
Our solar system is one of many solar systems located in the Milky Way Galaxy. This Galaxy is truly massive. The numbers I use below come from the following web pages: Source 1 and Source 2
Schematic 9.4 – Milky Way Galaxy
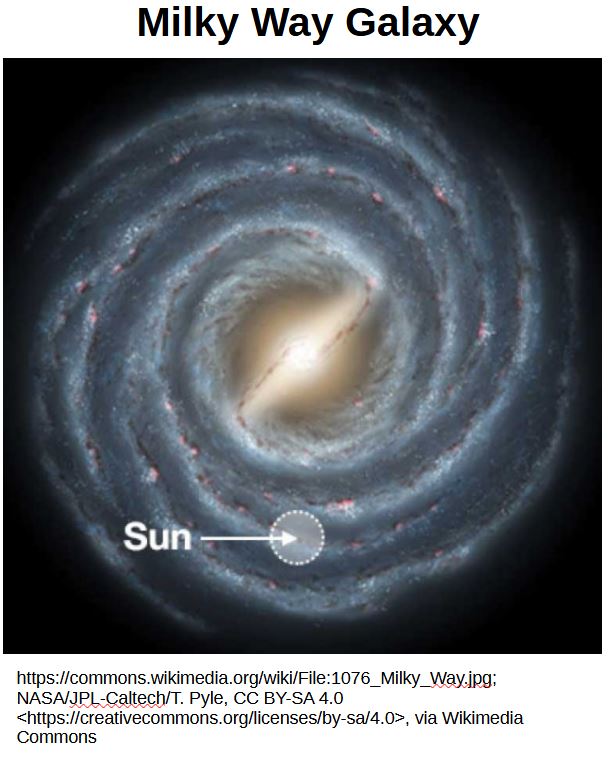
The Milky Way is a “barred (center area) spiral galaxy”. You have to make a lot of assumptions to guess how many planets and stars there are. It’s estimated there are 100 to 400 billion stars in the Milky Way. If we assume there are roughly 8 planets per star (like in our solar system), then the number of planets (in the Milky Way) could be as high as 3.2 trillion.
It’s pretty wide too. The Milky Way is roughly 87,400 Light Years wide! Astronomers use a more practical term to describe these awesome distances:
- 1 kiloparsec is 19.17E15 miles = 19.17 petamiles.
- The Milky way is 26.8 kiloparsecs wide (19,170,000,000,000,000 miles or 19,170 trillion miles!)
Is there a finite distance limit to what we can observe in the Universe? There is , but we need to talk about the Big Bang Theory first.
The Big Bang
The most accepted theory explaining the origin of the universe is the Big Bang Theory. It goes something like this:
- About 13.7 billion years ago, an infinitely dense point (a few millimeters in diameter; a singularity) violently exploded creating all matter, energy, space and time.
- The Universe has been expanding ever since
- There is evidence for this theory in the form of cosmic microwave background (CMB) radiation. Learning a little about the Electromagnetic Spectrum might help you understand the CMB discussion a little better.
This is a bit mind bending and challenging to really understand. For further study, I recommend you review the publications and videos of Neil DeGrasse Tyson, Carl Sagan , Stephen Hawking, Brian Cox and others.
The point of this section, though, is that current theory states the universe began about 13.7 billion years ago. Earth, by the way, is about 4.5 billion years old.
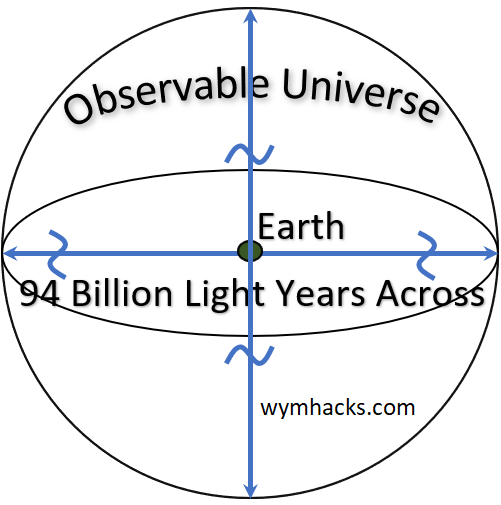
The Size of the Observable Universe
If the Big Bang was 13.7 billion years ago, then (if we assume the universe is fixed in size) that event would have occurred 13.7 billion light years ago. Since all forms of light (Electromagnetic Spectrum) travel at a fix rate (186,000 miles/second), we can compute a distance (recall that a Light Year = 5.87 trillion miles). We can call this distance the “distance to the edge of the Observable Universe”.
In reality this “distance to the edge of the Observable Universe” is not easily calculated because the Universe is continuously expanding. So whatever point of light we detect, the source of that light has continuously moved away from us. The actual distance is going to be larger than 13.7 billion light years.
According to NASA, “the most distant objects in the Universe are 47 billion light years away, making the size of the observable Universe 94 billion light years across“. That’s 94E9 x 5.86E12 miles = 5.5E23 miles = 8.86E26 meters! So, technically this is the biggest (largest) distance we can know today.
How many galaxies are there in the observable universe? Estimates range roughly between hundreds of billions to 1 or 2 trillion galaxies.
The Numbers are Astronomical
Hopefully this section makes it clear why the adjective “Astronomical” relates to very large numbers. Check out Sal Khan’s video on planetary scale.
Check out these informative sources as well:
Small Numbers
We saw in the “Astronomically Large Numbers” section that the observable universe is about 94 billion Light Years Wide. This represents the biggest comprehensible size or distance we know.
Now let’s go the other way. How small can numbers get?
We’ll use metric measurements starting with centimeters and go down to really tiny numbers.
Keep the following scale and nomenclature in mind. Moving down this scale involves dividing by factors of 10.
- 1 meter = 1 m
- .1 m = 1E−1 = 1 dm = 1 decimeter
- .01 m = 1E−2 = 1 cm= 1 centimeter
- .001 m = 1E-3 = 1 mm = 1 millimeter
- .000001 m = 1E-6= 1 μm = 1 micrometer = 1 micron (a millionth of a meter)
- .000000001 = 1E-9 = 1 nm = 1 nanometer (a billionth of a meter)
- 1E-10 m = 1 Angstrom
- 1E−12 m = 1 pm = 1 picometer (a trillionth of a meter).
- 1E−15 m = 1 fm = 1 femtometer
- etc.
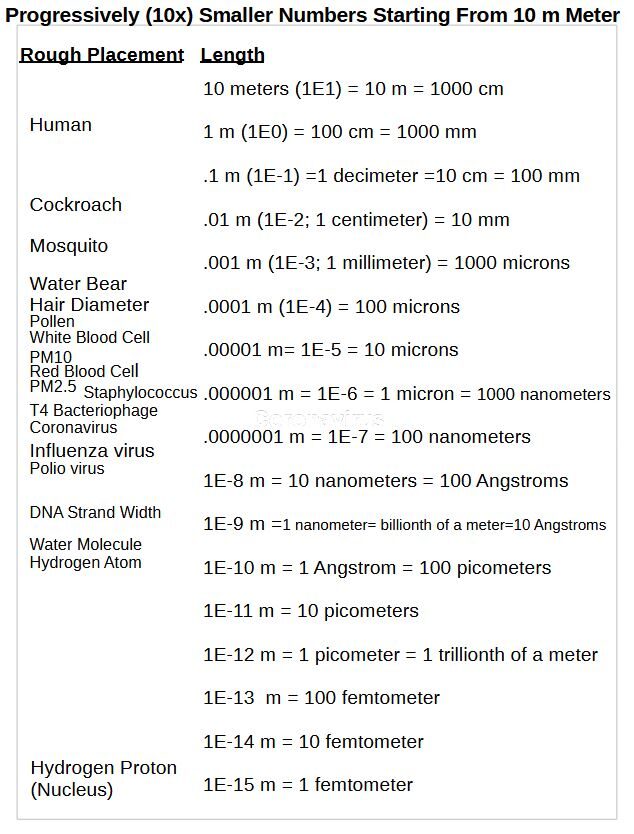
Ok, lets start relating to some of these numbers. The following schematics start with an average sized human being compared to several progressively smaller things. Dimensions are expressed in meters or fractions of meters.
If a 35 millimeter wide cockroach crawled up on my hand (assume I am 175 cm or 1.75 meters tall) , we could picture this to scale with Schematic 11.1. I’m about 50x bigger than the roach (thank God).
Schematic 11.1 – Scale (175cm/3.5 cm = 50x) : Man Relative to Cockroach

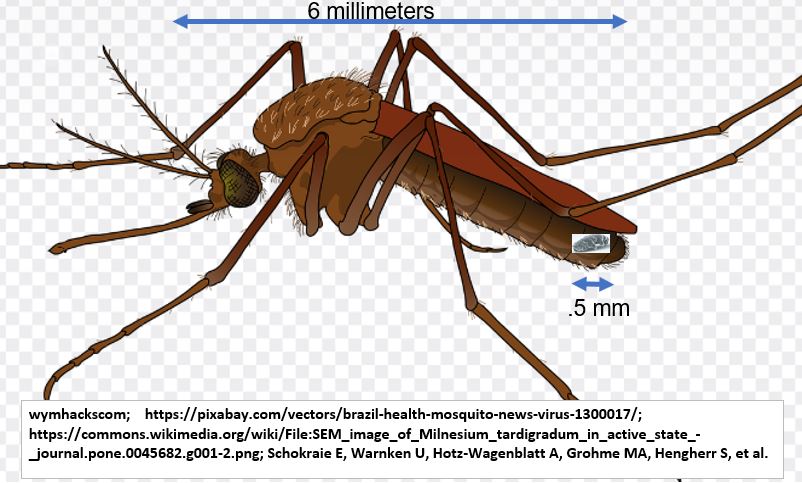
In Schematic 11.2 a 6 mm mosquito crawls on top of a 35 mm cockroach.
Schematic 11.2 – Scale (35/6 = 5.8x): Cockroach Relative to Mosquito

Schematic 11.3 shows the size of a mosquito relative to a Water Bear (Tardigrades). If you want an enjoyable diversion, learn more about this freakish little animal. It has major SKILLS.
Schematic 11.3 – Scale (6/.5 = 12x) : Mosquito Relative to Water Bear (Tardigrades)
We are now getting to the limits of our natural eye site; about .1 mm ( = 1/10 = the length of the yellow line between the first two markings in Schematic 11.4 below). A dot made by a fine ball point pen might be about .1 mm in width.
Schematic 11.4 – Rough Limit of Human Natural Eyesite (.1 mm)
The Water Bear is about .5 mm long. We can change the unit of measure here to micrometers making the Water Bear length about 500 micrometers (or microns). The Water bear is about 5x the width of human hair (roughly) and is 20x larger than a 25 micron pollen grain (see Schematic 11.5)
Schematic 11.5 – Scale (500/25 = 20x): Water Bear Relative to a Hair and a Grain of Pollen

Lets expand the Pollen Grain and compare it to even smaller things (Schematic 11.6) like human blood cells and dust particles. Dust particles including smoke is sometimes described as PM10 or PM2.5. This means Particulates less than or equal to 10 microns (PM10) or 2.5 microns (PM2.5) in size.
Schematic 11.6 – Scale 25/2.5 = 10x): Pollen to Blood Cells to Dust/Smoke

Schematic 11.7 compares a PM2.5 smoke particulate to a Staphylococcus bacteria, a bacteriophage virus (looks like a lunar landing probe!), and a Coronavirus. Roughly, bacteria sizes might range between 1 and 10 microns while viruses are smaller (ranging perhaps from the 10s to 100s of nanometers). Check out these awesome videos of these beautiful (often dangerous) creatures!
- A comparison of the sizes of various microorganisms cells and viruses
- How micro organisms look under the microscope
Schematic 11.7 – Scale (2500/140 = 18x): Dust/Smoke to Bacteria to Viruses

Schematic 11.8 shows more viruses. A Polio virus is roughly 12.5 times (25/2) the size (width-wise) of a double helix DNA molecule.
Schematic 11.8 – Scale (140/2 = 70x) : Viruses to DNA

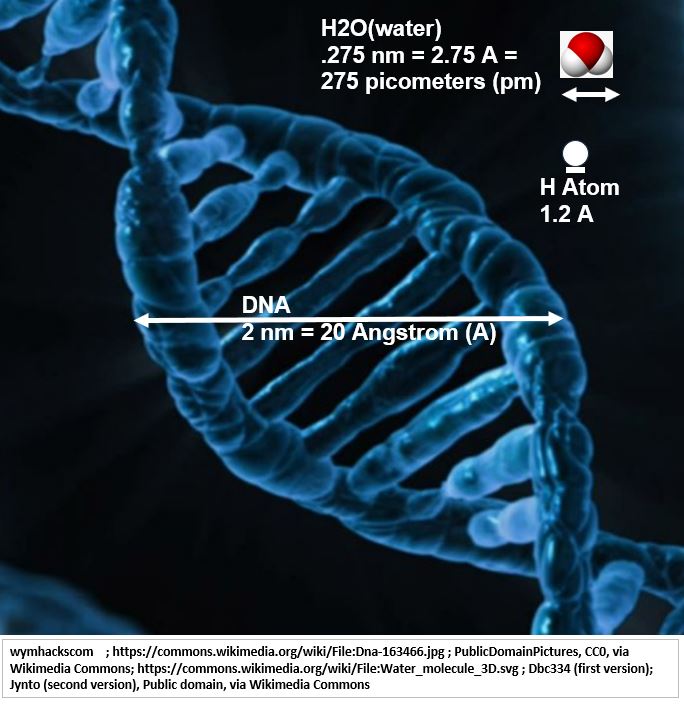
Schematic 11.9 puts us on an atomic scale. The width of a DNA molecule is roughly 2 nanometers (2 nm = 2 billionths of a meter). A water molecule (H2O) has a width of about .275 nanometers and a single Hydrogen atom has a width of about .12 nanometers. We can express these atomic scales in units of Angstroms where an Angstrom is 1E-10 meters = .1E-9 m = .1 nm.
Schematic 11.9 – Scale (20/1.2 = 16.7x): DNA to Water Molecule to Hydrogen Atom
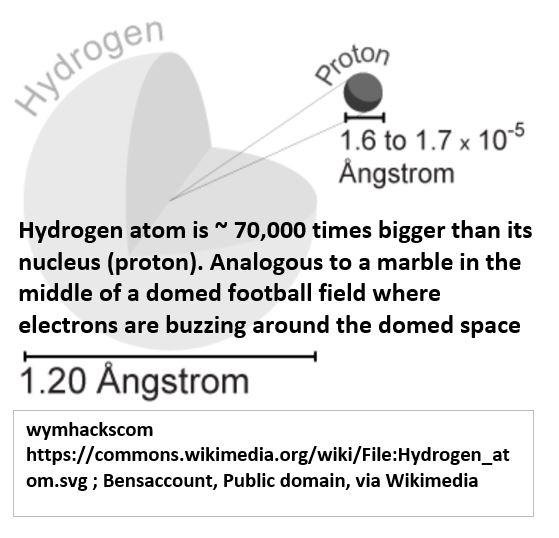
Now we are fully in the realm of atoms and their components. If we look at a single Hydrogen atom (Schematic 11.10 below), its diameter might be roughly 1.2 Angstrom (1.2E-10 meters = 120 picometers). You would have to line up about 8 million Hydrogen atoms to match 1 millimeter (mm) of length!
Atoms consist of a nucleus (typically consisting of protons and neutrons, but in the case of Hydrogen, just a proton) and electrons. The electrons are located in various regions (orbitals) of the spherical space shown in the schematic.
When we talk about the proton of a Hydrogen atom, it only has a diameter of about 1.7E-15 meter or 1.7 femtometers. This makes the full Hydrogen atom space about 70,000x larger than its proton.
Let’s relate. A rough analogy to this scale would be a marble placed in the middle of a football superdome stadium, where electrons buzz around in the full dome space (relative to that tiny proton marble sitting in the middle of the field).
Schematic 11.10 – Scale (1.2E-10/1.7E-15 = 70,588x) : Hydrogen Atom Relative to Hydrogen Nucleus (Proton)
Schematic 11.11 matches the size of the various objects shown above against a list of progressively smaller lengths. Each lower “rung” of this size ladder represents a length that is 10x smaller (starting at 10 meters and going all the way down to 1 femtometer aka 1E-15 meters).
Schematic 11.11 – Scale: Progressively Smaller (10x) Scaled Table
The Numbers Can Get Nearly Infinitesimal
Is there a practical limit to how small measurements can get? Max Planck derived a length from some fundamental constants of physics equaling about 1.6E-35 meters. This is called the Planck Length and it’s mostly (only?) useful when doing theoretical physics:
Planck Length = .000000000000000000000000000000000016 meters
The Planck Length is considered to be the smallest length that could theoretically be measured with any kind of accuracy. You’ll have to do your own studies to learn more about this. Check out these awesome graphics and video as well: The Scale of the Universe Graphic ; Visualizing The Planck Length
Ok, all this to say, “numbers can get really small”; Check out Sal Khan’s video on scale of the small.
Appendix 3 – Using Volume to Convey Size
People in the business of tracking energy production and consumption often use volumes in the billions and trillions. You can visualize cubes of different sizes to relate to volumes. Imagine we have several cubes starting with one that has 1 meter length sides.
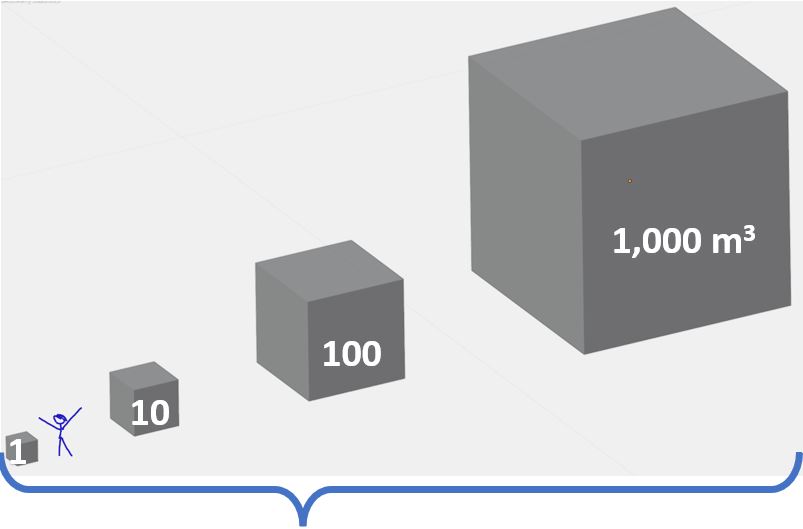
In Schematic A3.1 you can see that a cubic meter is roughly half the height of a male whereas a 1000 cubic meter has side lengths of 10 meters. You can use this to visualize how much larger 1000 cubic meters are compared to 1 cubic meter.
Schematic A3.1 – 1 Cubic Meter to 1000 Cubic Meters
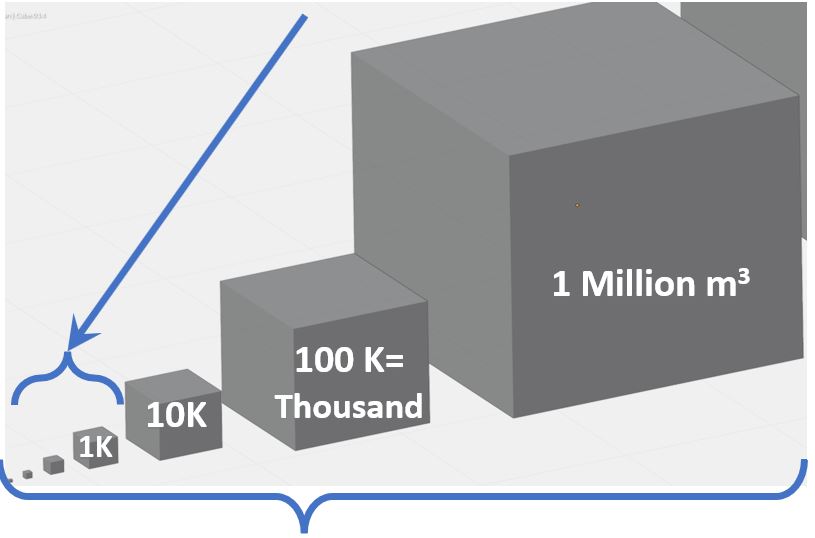
If we zoom out, where the 1000 cubic meter block above shrinks down to the 1K block below (K is short for 1000), we get the view in Schematic A3.2. The million cubic meter block is 1000 times as big as the 1000 cubic meter (1K cubic meters) block.
Schematic A3.2 – 1 Cubic Meter to 1 Million Cubic Meters
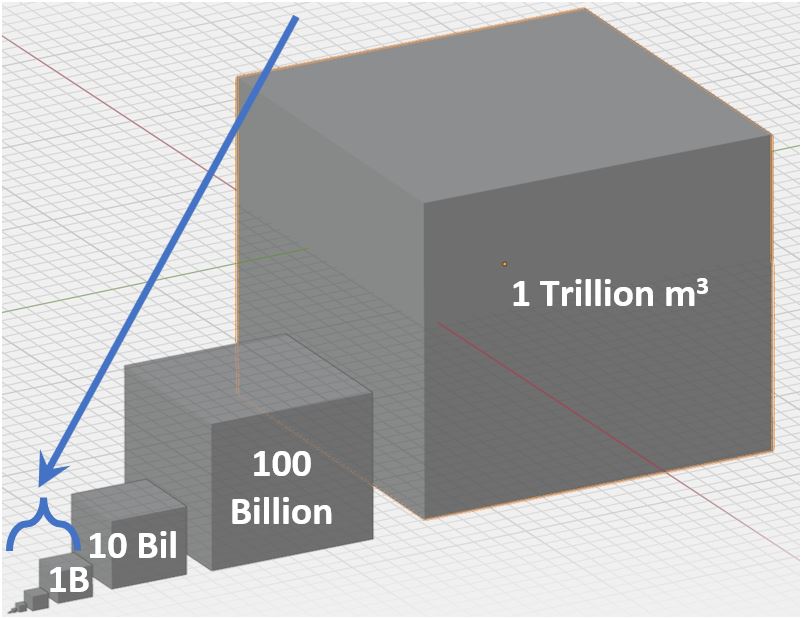
If we keep shrinking, we can see how much bigger a billion cubic meters is relative to a 1 million cubic meters (1000x) and
Schematic A3.3 – 1 Cubic Meter to 1 Billion Cubic Meters
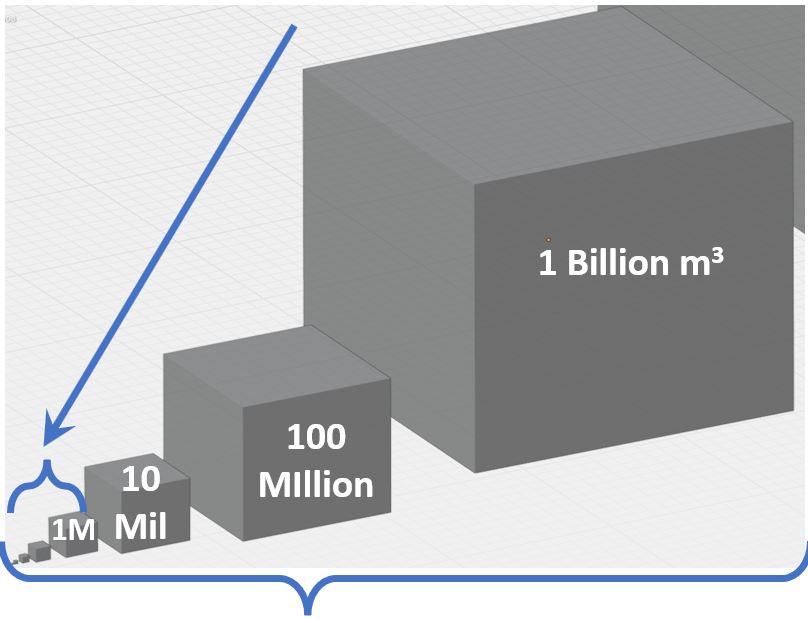
how much bigger a trillion cubic meters is relative to 1 billion cubic meters (1000x).
Schematic A3.4 – 1 Cubic Meter to 1 Trillion Cubic Meters
The Schematic A3.4 gives you a sense of the relative size of these numbers. A human is an imperceptible spec as she stands by the left most 1 meter squared cube.