CAGR Foundations – Arithmetic Mean
Before introducing the CAGR, let’s first discuss the concept of the “Average”.
Consider a list of arbitrary numbers.
Add up the numbers and ask yourself: What is the equivalent constant value that will sum up to the same total?”
The answer is: The Arithmetic Mean of these numbers.
Table 1 shows an example of this with a list (data set) of numbers 1, 3, -2, 5 and 8.
- The sum is 15 and if we take the Arithmetic Mean of the data set we get 3.
- Three, 5 times, gives you 15.
- So, the sum of the original values and the sum of the constant average value are the same.
Table 1
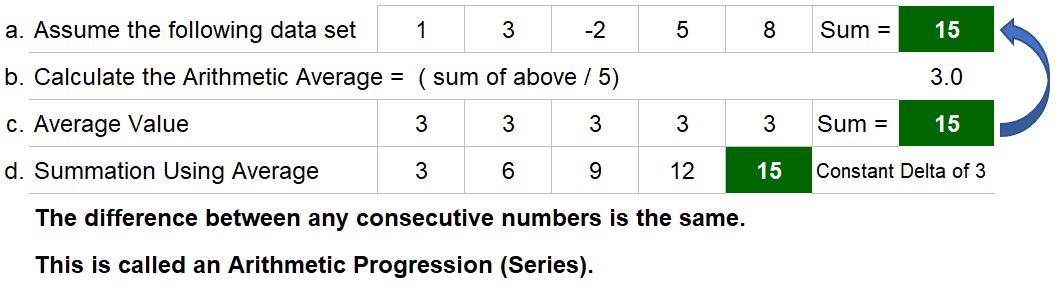
From Table 1 we see that the cumulative sequence of numbers when we add the Arithmetic Average to itself are 3, 6, 9, 12, and 15.
This kind of data set, where the difference between each consecutive number is the same, is called an Arithmetic Series (Progression). This is an example of an Additive Series of numbers.
We could have just described the Arithmetic Mean as the Average, but we would be more correct in saying that it is one kind of Average.
Another kind of Average is the Geometric Mean and we’ll get to that later on.
But we can say that the Average (Mean) represents the “central tendency” of a data set.
The usefulness of the average depends on the type of data and how it is distributed. Descriptive statistics like Mean, Mode, Median, Standard Deviation all key off the definition of Average.
CAGR Foundations – Geometric Mean
Consider a list of numbers.
Multiply all the numbers in the list to produce a product value and ask yourself:
- What is the equivalent multiplier constant that will equal this product value?
- The answer is: the Geometric Mean.
Refer to the example in Table 2.
Consider the data set of 1.1, 1.3, .9, 1.2, and 1.4.
- If we multiply these together we get 2.162.
- The 5th root of this product is 1.167.
- This value is called the Geometric Mean, and in a later section we’ll provide some examples of why the term “Geometric” is used.
Table 2
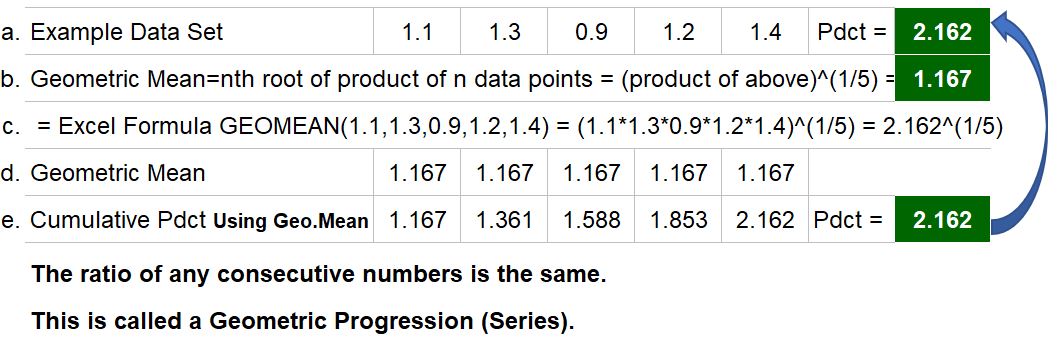
The Geometric Mean is defined as the nth root of the product of n data points.
In our example we had 5 data points and their product was 2.162, so the Geometric Mean will be (2.162)^(1/5).
This equation notation says:
- take 2.162 and raise it to the 1/5 power which is the same thing as saying, take the 5th root of the product.
- There is an excel computational function called GEOMEAN() which will do this calculation.
CAGR Foundations – Geometric Series (Progression)
Back to our example in Table 2 above.
The Geometric mean is 1.167 and if we multiply it by itself 4 times we get the progressive data set 1.167, 1.361, 1.588, 1.852, and 2.162 as shown in row e.
Notice that the final product (2.162) is equal to the product of the original data set (row e vs row a).
We’ve answered the original question: we can multiply using a constant 1.167 and get the same product as the original data set.
When the ratio of consecutive numbers is the same we have a Geometric Series (Progression).
The main observation to remember through these examples in Table 1 and Table 2 is that Arithmetic Series of data are additive and Geometric Series of data are multiplicative.
CAGR – Growth Factors
Investment performance is a multiplicative process with each year’s value being based on the cumulative value from the previous year.
Let’s take a look at a simple example in Table 3.
Consider a beginning investment of 100 dollars which
- gains 10% in the 1st year,
- earns 30% in the 2nd year,
- loses 10% in the 3rd year,
- gains 20% in the 4th year, and
- gains 40% in the 5th year.
Values of the investment are shown in row a of Table 3.
These can be computed by multiplying the growth factors in row b. by the latest cumulative value in row a.
The growth factors are simply 1 + the gains or losses noted above (e.g. loss of 10% = growth factor of 1-10% = .9).
Table 3
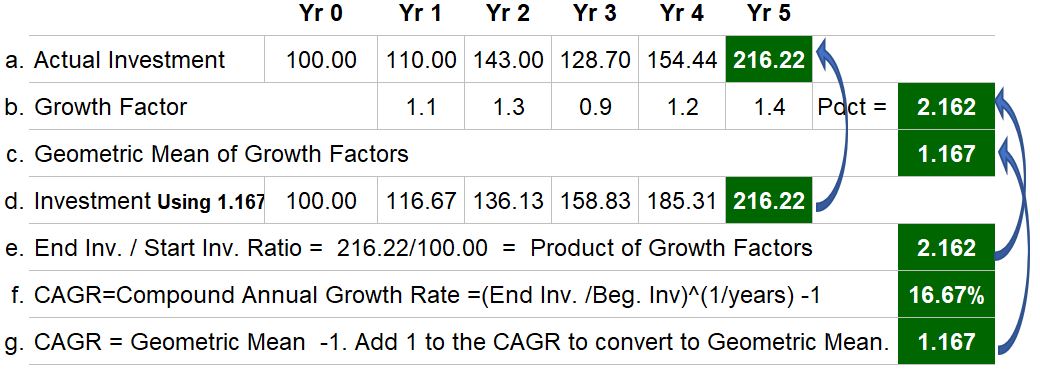
Since the Growth Factors are consecutive multipliers, we will compute their Geometric Mean to get 1.167.
Remember that the Geometric Mean is the nth root of the product of the growth multipliers (we can use the GEOMEAN function if we are using Excel).
If we start with 100 and consecutively multiply by the same constant Geometric Mean (1.167), we will get 216.22 (see row d. in Table 3).
This is the same product we get from the actual investment data in row a in Table 3.
Note also, in row e, that the ratio of the ending investment value to the starting investment value is also equal to the product of the Growth Factors (2.162).
Hopefully this is obvious, right? Y * A * B = C means that C/Y = A * B.
Why the CAGR is Called a Geometric Mean
The Geometric Mean appears when describing properties of Rectangles, Squares, Similar Triangles (among other geometrical configurations) and this is why the word “Geometric” is used to describe it.
We’ll stick to Rectangles and Squares and see how the Geometric Mean manifests itself.
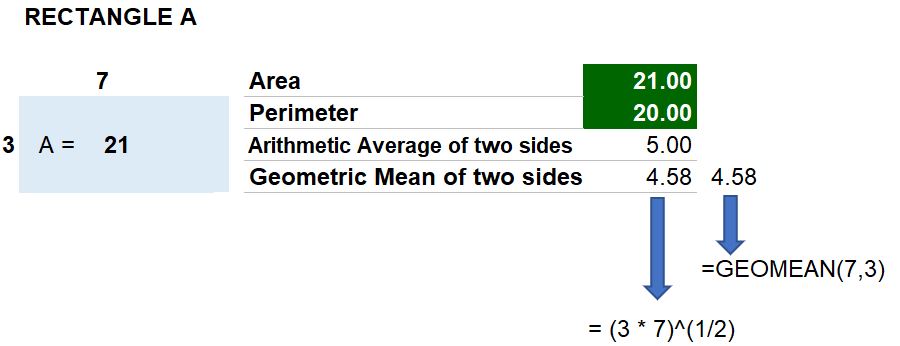
Consider Figure 1 below where we have a Rectangle A with a width of 3 and a length of 7.
- The area of Rectangle A is 7 * 3 = 21.
We want to answer the following question: What square (i.e. equal sides) dimensions are required to have the same area as the Rectangle A?
- Let’s take the Arithmetic Mean of the rectangle’s width and height: (7+3)/2 = 5.
- Let’s also calculate the Geometric Mean: (3*7)^(1/2) = √(3*7) = 4.58.
- Remember that the Geometric Mean formula notation is translated as: take the square root of the product of 3 and 7.
Figure 1
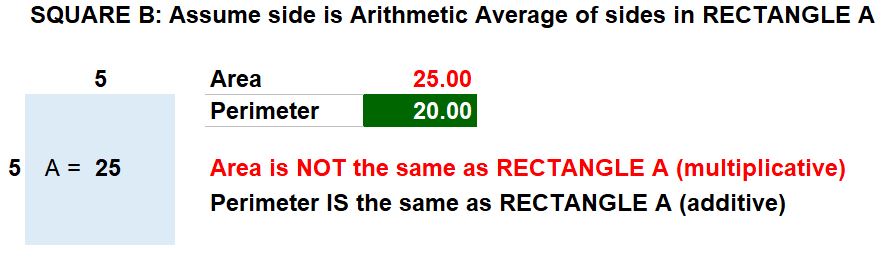
- Now let’s test out these two guesses for our square dimensions.
In Figure 2 below, when we use the Arithmetic Mean derived length, 5, we see that the area is 25.
This does NOT equal the area of Rectangle A (which is 21).
But note that the perimeter of Square B is equal to Rectangle A (20).
Figure 2
In Figure 3 below, when we use the Geometric Mean derived length, 4.58, the resultant Area of the square (21) does equal the area of Rectangle A.
But note that the perimeter does not.
Figure 3
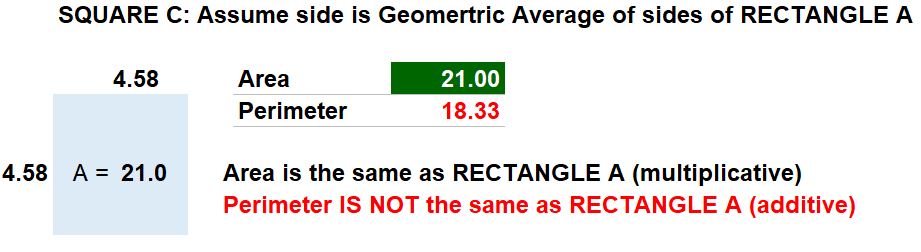
Since area is a multiplicative value, the Geometric Mean is the correct method to find the dimensions of a square with an equivalent area.
Since the perimeter is an additive value (sum of the sides), the Arithmetic Mean is the correct method to find the dimensions of a square with an equivalent perimeter.
In the following sections we’ll review three more examples and learn a little bit more about computing the CAGR.
Use CAGR and not the Arithmetic Mean
Consider the example in Table 4 below.
You invest 25 dollars and, after a year, it’s worth 50 dollars and, after two years, it’s worth 25 dollars.
Congratulations, your money has done a full round trip and earned nothing.
Well, you actually lost money because the purchasing power of your dollar is probably less now as well (inflation).
If you do a CAGR calculation, the result gives you a correct 0% annualized growth.
Table 4
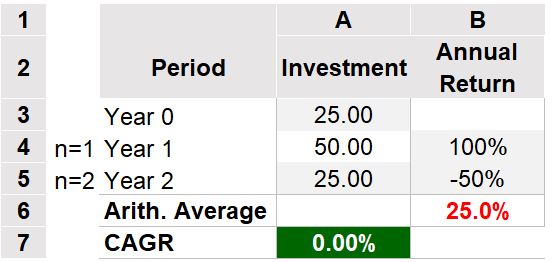
If you had measured the yearly returns (100% and -50%) and averaged them, you would get 25%.
The average return is meaningless here.
Investment returns are multiplicative which means you want to use the Geometric Mean (or CAGR = Geometric Mean -1 ).
Ok, the above is a bit of an absurd example but hopefully drives home the point.
Let’s look at another example.
Actual Investment vs Constant Average Growth Investments
In the example Table 5a below, we make another 3 year investment where 25 Dollars are invested and grow to 26 dollars after the first year and grow to 60 dollars in the second year.
This means the annual growth rates were 4% and 131% in each year and, the associated growth factors were 1.04 and 2.31 (column C).
If we do a CAGR calculation, we get (60/25)^(1/2) – 1 = 54.92%.
The investment has an annualized growth rate of 54.92%.
Table 5a
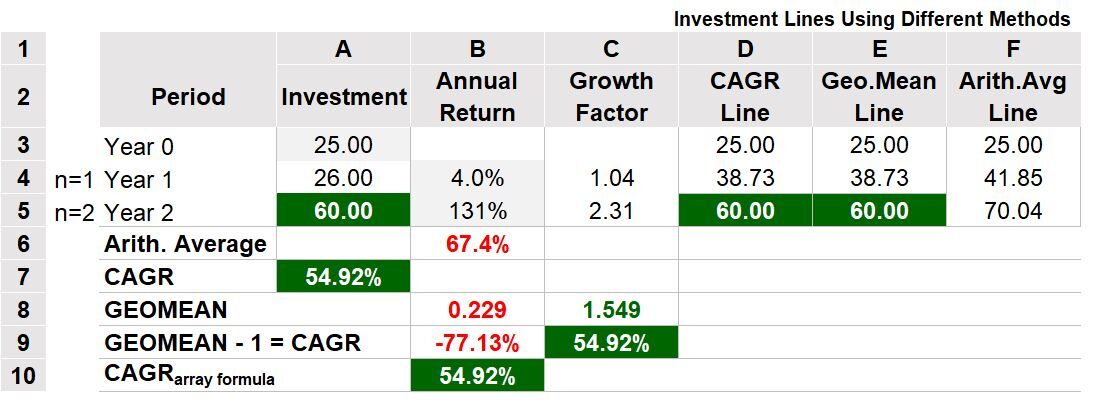
The Geometric Mean = (product of growth factors)^(1/2) = 1.549 (row 8, column C) .
Note you can subtract 1 from the GEOMEAN and get the CAGR as well (row 9, column C).
Table 5a shows the WRONG calculations in red.
The Arithmetic Mean (Average) of the annual returns, 67.4% (row 6, column B), is incorrect.
If you use this average rate, the final value of the investment would be 70.04 dollars (column F).
For you Excel users: In row 10 of Table 5a, there is an Excel array formula that can compute the CAGR based on annual returns ({=GEOMEAN(annual return range +1)-1} ).
Notice that this formula takes the annual returns, converts them to growth factors by adding one, does the Geometric Mean calculation, then subtracts 1.
A Small Important Diversion
- In Table 5a, row 8, column B, taking the Geometric Mean of the annual returns (.229) is not correct if we want to know the annualized growth rate.
- The Geometric Mean must be based on the growth factors and not the annual returns.
- See the Appendix for additional information on this.
In columns D, E, and F of Table 5a, the year one and year two investments are based on constant values as computed by the CAGR (Geometric Mean – 1) or Arithmetic Mean.
If we chart columns A, E, and F, we get Graph 1 below.
Graph 1
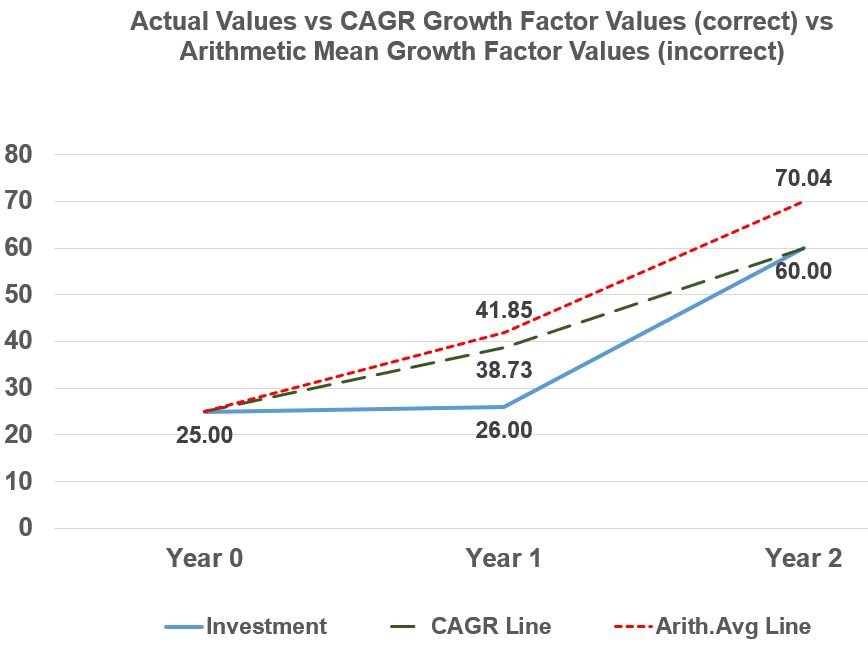
In Graph 1, the Arithmetic Mean (Average) line is incorrect and ends up with a value greater than the actual final investment value.
On the other hand, the CAGR line represents a smoothed version of the actual investment line and correctly ends up at the same final value.
Graph 1 shows that when you describe the average return using the Geometric Mean, you are simply drawing a smoothed representative line that does not represent the actual data in the years before the final value.
In the next and final example, we’ll look at an investment that loses value in some years.
Investment Growth Rate Example with Negative Returns
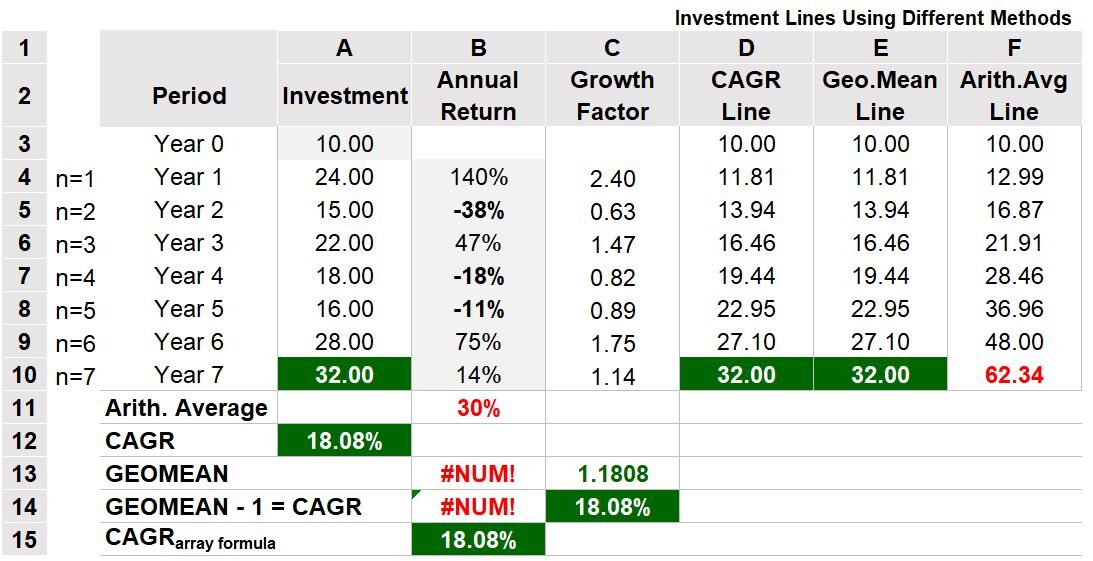
See Table 6 below for an investment example spanning over 7 years where there are some yearly losses that occur.
As in Table 5a,
- the CAGR is computed using the investment values in column A and
- the Geometric Mean (using the Excel GEOMEAN function) is correctly applied to the growth factors (column C) and
- incorrectly applied to the annual return values in column B.
- In this example, Excel gives an error message of #NUM in rows 13 and 14.
- This is because the Geometric Mean cannot be computed with negative values.
Let’s repeat that the Geometric Mean needs to be calculated on the growth factors (1 + returns) and not annual returns.
In this example,
- a -38% return (row 5 , column B) is equivalent to a .63 (1-.38 = .63) growth factor (row 5, column C) and
- a -18% return (row 7, column B) is equivalent to a growth factor of .82 (row 7, column C) etc.
- The Excel CAGR array formula ({=GEOMEAN(annual return range +1)-1} ) does not return an error message because it is using the growth factor in its calculation.
Table 6
If we graph the actual investment values vs the CAGR based investment values vs the Arithmetic Mean based investment values (columns A, D and F in Table 6), we get Graph 2 below.
Graph 2
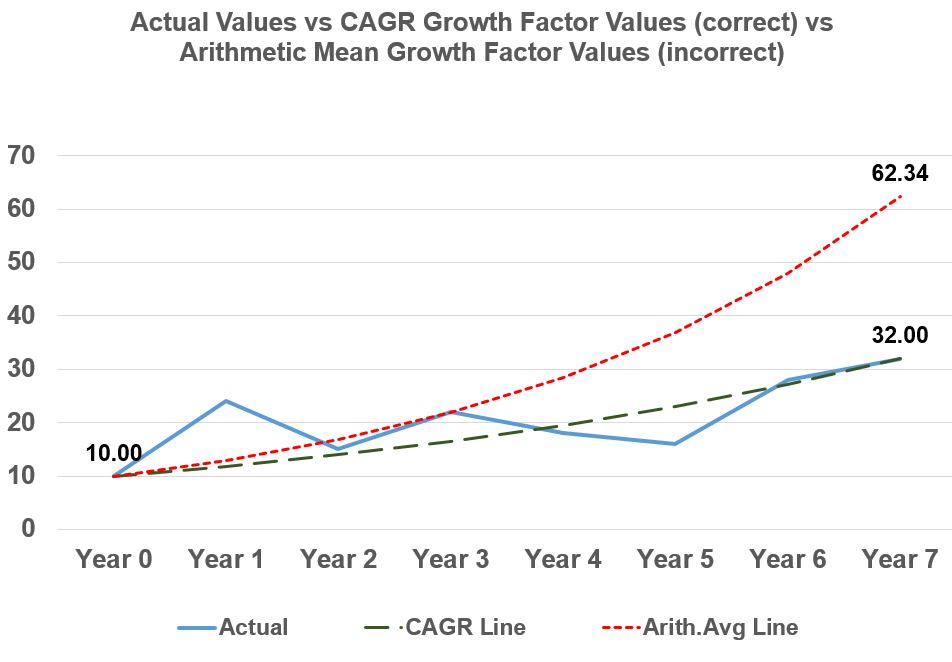
Like Graph 1, Graph 2 shows that the Arithmetic Mean line is incorrect and overestimates the final investment value, whereas the CAGR line exactly matches the final investment value and arrives there in a smoothed fashion.
Let’s finish up the post with some conclusions.
APPENDIX
Geometric Mean Should be Computed on Growth Factors and Not Annual Returns
In Table 5a, row 8, column B, taking the Geometric Mean of the annual returns (.229) is not correct if we want to know the annualized growth rate.
The Geometric Mean must be based on the growth factors and not the annual returns.
So, the .229 Geometric Mean in row 8, column B (and the -77.13% CAGR in row 9, column B) are only valid if we assume that the yearly growth factors were 4% and 131% (not the annual returns).
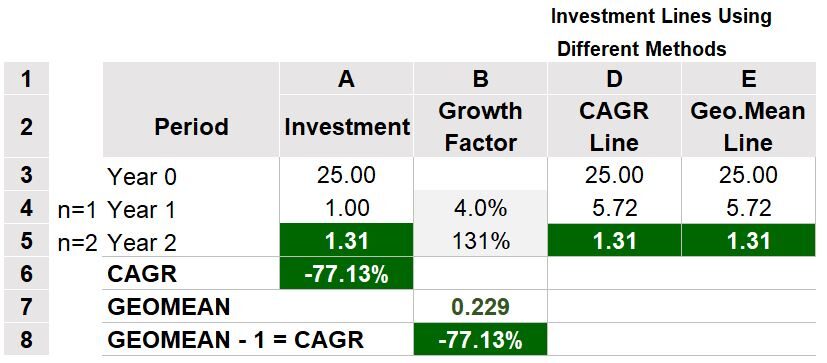
If this is the case, then Table 5b below correctly shows the investments related to yearly growth factors of 4% and 131%.
They would be 25, and 1, and 1.31 as shown in column A.
But the example of Table 5a is not dealing with this investment scenario. So, only take the Geometric Mean of the growth factors of the investment you are trying to assess.
Table 5b