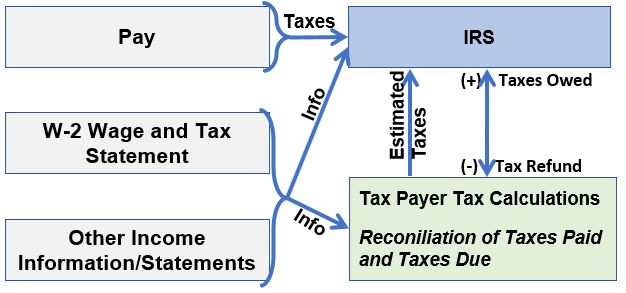
Understand Your US Federal Taxes
Let’s run through a hypothetical US Federal Tax Filing using an Embedded Tax Calculation Tool.
Understand Your US Federal Taxes Read More »
The personal finance category includes the usual topics that a certified financial planner would study and then provide advice on (planning, statements, time value of money, education funding, investments, retirement, income tax, etc.
Let’s run through a hypothetical US Federal Tax Filing using an Embedded Tax Calculation Tool.
Understand Your US Federal Taxes Read More »
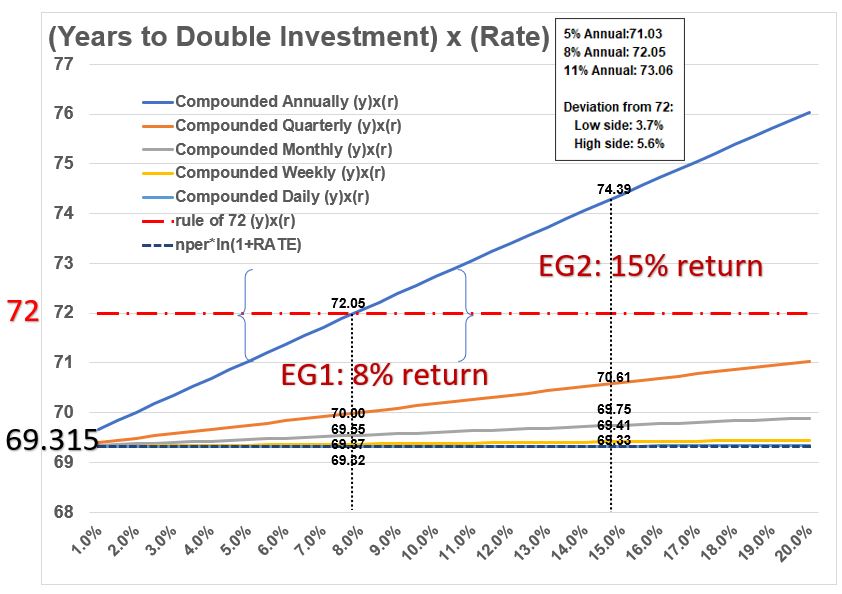
Last Update: February 23, 2023 Introduction: The Rule of 72 The rule of 72 is a useful way to quickly compute the number of years it will take to double an investment. Rule of 72: Doubling Time in Years = 72/(annual rate of return entered as a %). For example, if the rate of return

Last Update: January 21, 2023 Introduction This post describes key Macro-Economic concepts like inflation and interest rates and how government fiscal and monetary economic policies influence them. The US Government, through its Fiscal and Monetary policies, has an enormous influence over our ever day lives as it attempts to keep the US economy growing and
Macro-Economics and US Government Economic Policies Read More »
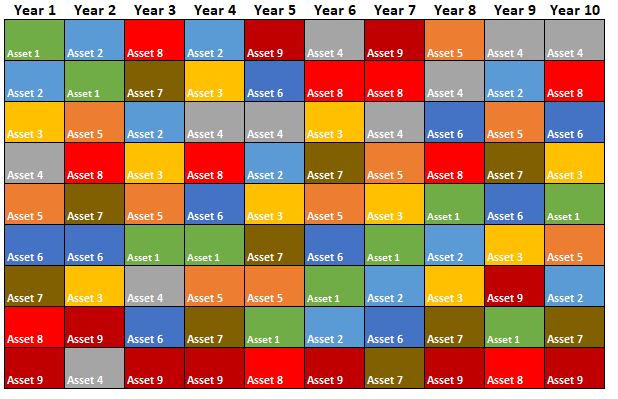
Last Revision: November 20, 2022 Asset Class Performance: Introduction Understanding asset class performance is an important part of assembling the proper investment portfolio mix. This post analyzes the historical performance of various assets using ETF and Mutual Fund proxies. Its purpose is to show the historical ranked returns of several asset classes. the volatility
Asset Class Performance Read More »
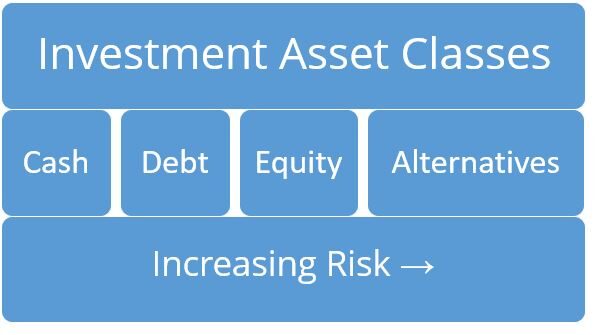
Last Update: November 7, 2022 Introduction This post provides a broad review of available investment asset classes. The sec.gov glossary defines an investment as “..money that is put at risk for the purpose of making a profit”. In this post, we’ll review the various investment choices available to United States citizens. I think there are
Investment Asset Classes Read More »
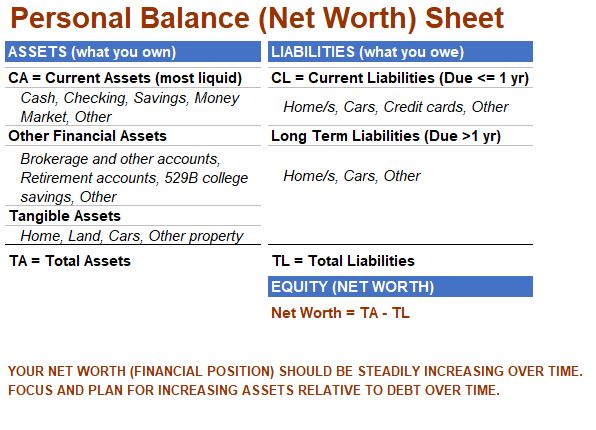
Last Update: November 6, 2022 The Power of Personal Financial Statements This post describes two very important tools that every person should utilize: The personal Balance Sheet (Financial Position) and the personal Income/Expense (Cash Flow) Sheet (or Statement). You cannot improve your financial situation if you don’t track and measure it. Recall from my Accounting
The Power of Personal Financial Statements Read More »
Last Revision: February 2, 2024 Introduction You need to learn a little bit of accounting. It involves keeping track of the “numbers” and trying to understand them to gauge/track performance and make future plans. Your personal budget and financial plan is all about accounting, as well as the businesses you invest in and perhaps even
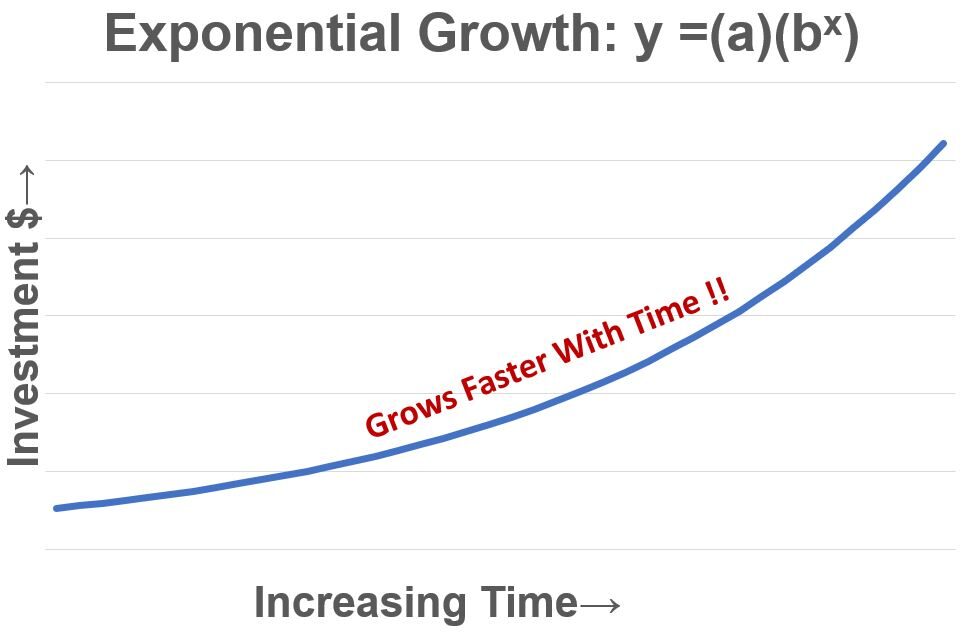
Last Revision: September 29,2022 Introduction The power of compounding allows money to grow exponentially over time. That is, over time, the growth accelerates! So start investing (for yourself or your kids) as early as possible to maximize the amount of money you’ll have in the future. Schematic 1: Compounding – (a) grows exponentially by (bx)
The Power of Compounding Read More »

Last Revision: August 31, 2022 Introduction In this post, I’ll provide a basic description of corporate stocks and bonds. I’ll first introduce them in the context of the overall cash flow in a corporation, and then I’ll provide some key characteristics for each. Why should we care about this? Why is this important? Well, humans own,
Cash Flow, Stocks, and Bonds Read More »

Introduction This article defines Capitalism and its tools of implementation: Economics, Finance, and Accounting. Economics, Finance, and Accounting explain the flow of money and assets in society. Corporations, the engines of growth in capitalistic systems, utilize these concepts/tools/techniques to maintain and increase our standard of living. Similarly, individuals can use a baseline understanding of these
Definition of Capitalism, Economics, Finance, and Accounting Read More »