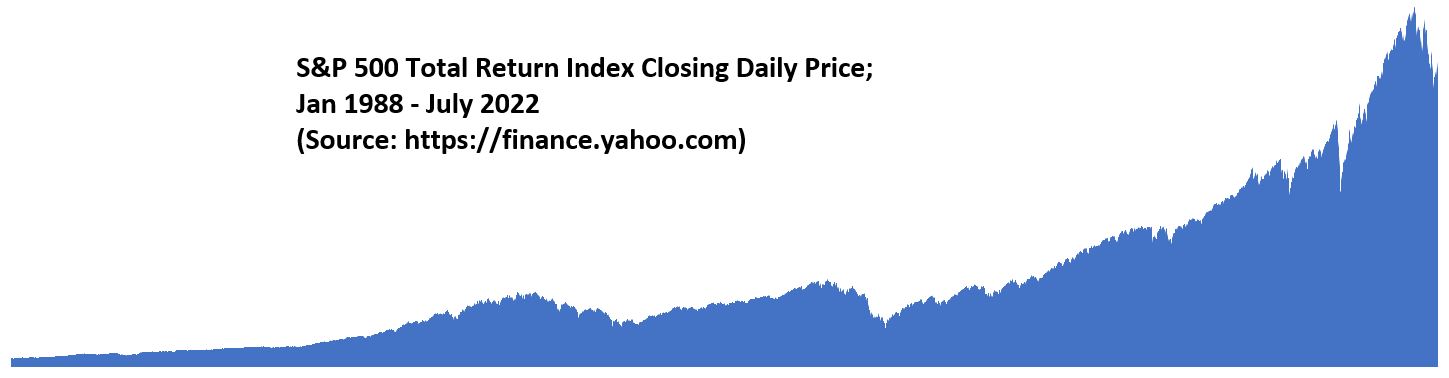
S&P500 Index Performance with Best Days Removed
Last Revision: August 14, 2022 Summary This post describes how the long term performance of the S&P 500 Total Return Index is affected when some of the best days are removed. Introduction I was recently perusing Chapter 2 of my copy of Charles D. Ellis’s book, “Winning the Losers Game” (3rd Edition, New York,McGraw-Hill,1998). The […]
S&P500 Index Performance with Best Days Removed Read More »