Last Revision: August 14, 2022
Summary
This post describes how the long term performance of the S&P 500 Total Return Index is affected when some of the best days are removed.
Introduction
I was recently perusing Chapter 2 of my copy of Charles D. Ellis’s book, “Winning the Losers Game” (3rd Edition, New York,McGraw-Hill,1998). The title of this Chapter is “Beating the Market”.
In Chapter 2, Ellis describes various ways in which professional investment managers have “beaten the market”.
The conclusion of the chapter is: All the strategies require others to be wrong for someone else to be right.
Ellis argues that in a hypercompetitive and information rich environment, it will be difficult for most to consistently beat the market.
One of the market beating strategies discussed is “market timing” i.e. buying low , selling high.
Ellis argues that this is extremely difficult to do and posits that the biggest risk for most investors will be not being in the market for the long term.
Have you heard the adage “Time in the Market is More Important than Timing the Market” ?
Ellis shows a compelling graph displaying how severely the S&P 500 Index compounded returns are affected when 10 or 20 of the best “up” days are removed.
Instead of just summarizing what Ellis found, lets do this calculation ourselves and see if we come to the same conclusions.
You can download the spreadsheet I used here ( Best Days Analysis Spreadsheet ).
You can also refer to my Financial Glossary as needed.
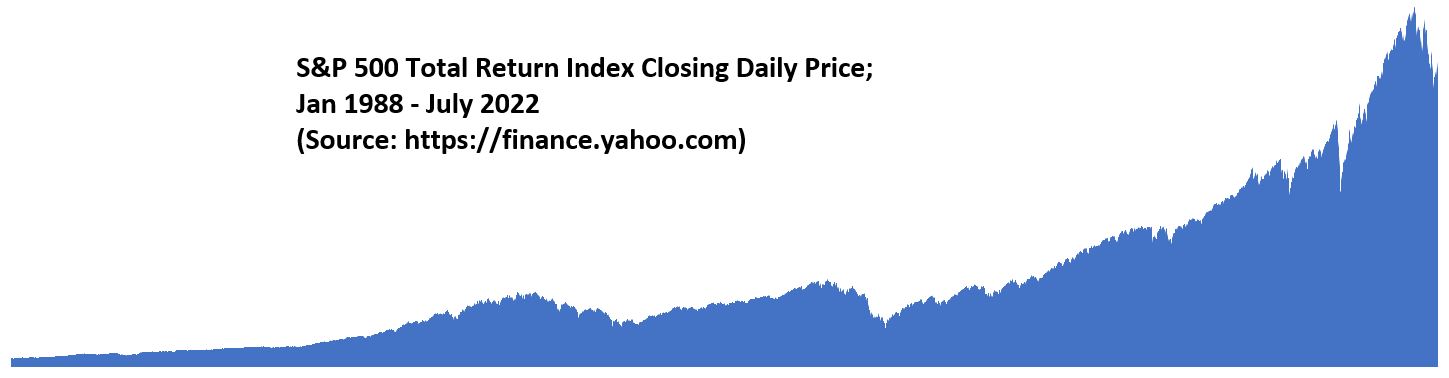
S&P500 Total Return Index
I chose the S&P500 Total Return Index as a proxy for the U.S. Stock Market.
This Index assumes all dividends are reinvested.
I downloaded 8,711 daily closing prices into an Excel spreadsheet (see link above) which represents over 34 years of data from Jan 4, 1988 to July 27, 2022.
The data was downloaded from Yahoo Finance ( Name of quote: ^SP500TR; Website: https://finance.yahoo.com/ ).
Methodology
The following methodology was used:
- Download the daily S&P 500 daily closing prices into an Excel spreadsheet.
- Compute the daily returns as (Latest Price – Previous Price)/Previous Price
- Sort the Spreadsheet by highest 20 daily returns and rank these items accordingly
- Re-Sort the spreadsheet by date (earliest to latest)
- Compute three investment growth columns using a hypothetical starting investment of $10,000
- The first daily investment growth column incudes all days.
- The second investment growth column excludes the 10 best return days.
- The third investment growth column excludes the 20 best return days
- No fees or taxes are included for moving in and out of the market
Results
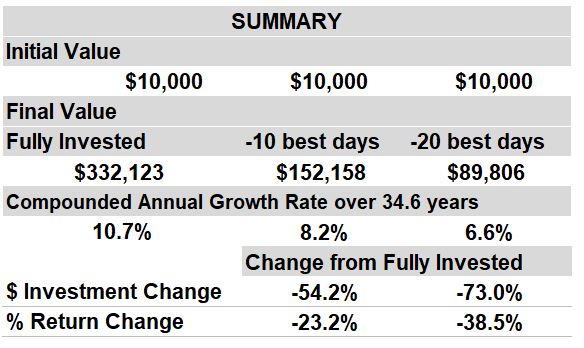
Table 1 summarizes the CAGR, Compounded Annual Returns, of a $10,000 investment in the S&P 500 Total Return Index.
If all days are included, the initial investment grows to $332,123 which reflects a CAGR of 10.7%.
Look what happens when the best 10 and 20 best days are removed: the final investment value drops from $332,123 to $152,158 and $89,806 respectively!
Those are respective drops of – %54.2 and -73% !
Table 1 (Summary of S&P 500 TR Index CAGR 1988 to 2022)
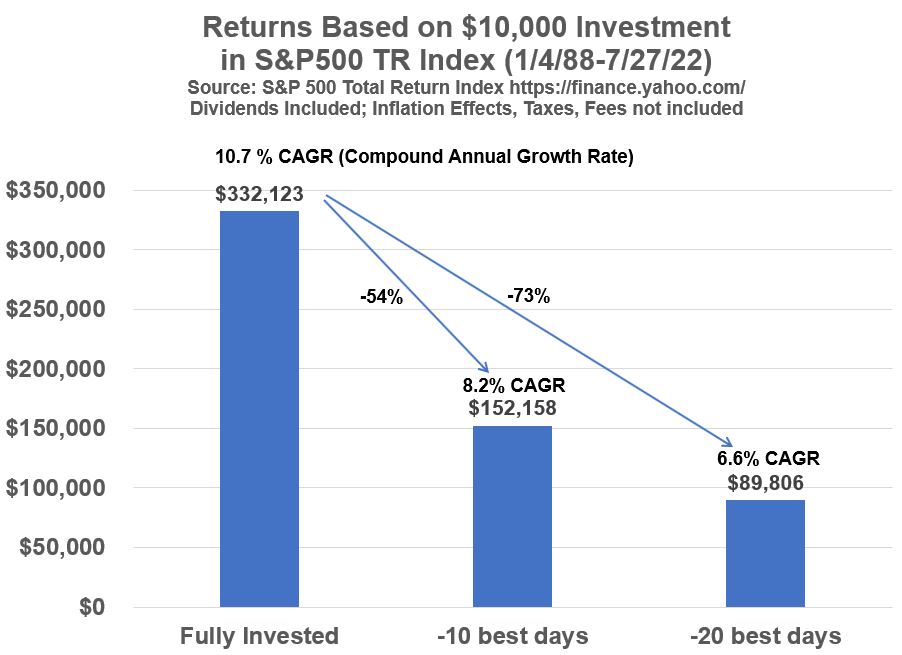
See Graph 1 for the same results in a picture.
Graph 1 (S&P500 TR Index Investments with 10 and 20 Best Days Removed)
Conclusion
Ellis chose a different period to compound, so my numbers don’t match his.
Also, I cant be sure that he did the calculations in the simplified way that I did them.
But the learning is the same; leaving out just a few big days can really hurt your returns.
If you scour the internet you’ll find similar studies done by various investment advisory firms.
A few select days greatly impact the compounded long term returns of stock investments.
In our example we are talking about 20 days out of 8711 days!
Some of you are saying, the analysis is misleading because the odds of anyone actually experiencing all these down days are very low.
The way I would use the data is to gently remind myself from time to time that
(1) trying to time the market by jumping in and out will be very difficult and
(2) the penalty for doing so could be great due to the influence of a few days (and due to the power of compounding).