Metabolic Routes In the Fed and Fasting States
Chart of Metabolic Routes from Central Metabolism Hub
Last Update: November 3, 2024
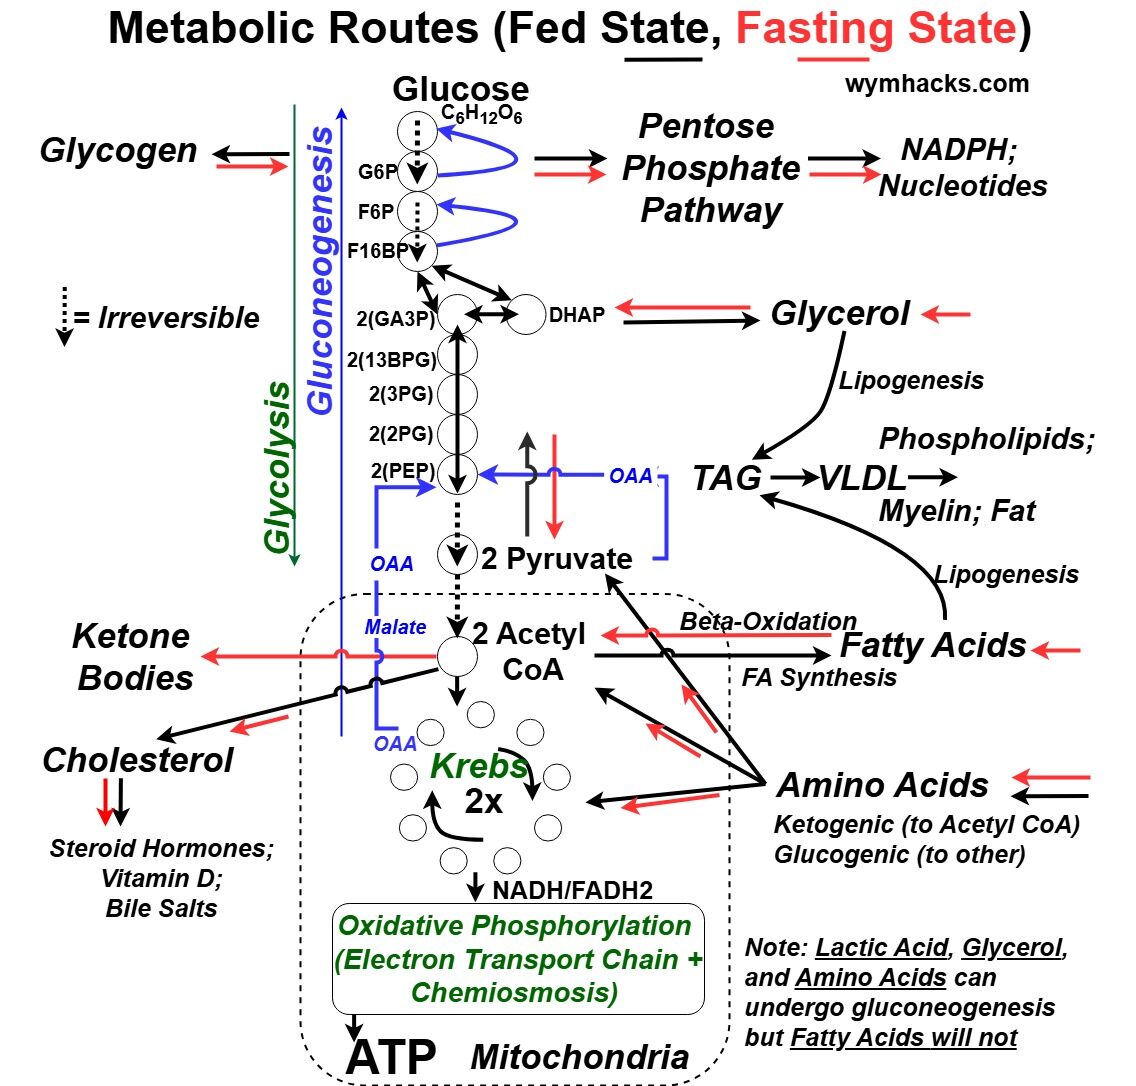
Picture_Metabolic Routes from Central Metabolism Hub (Fed State and Fasting State)

Cellular Respiration can be seen as a core metabolic hub, connecting various catabolic and anabolic pathways.
For this reason, it’s sometimes described as Central Metabolism.
The main purpose of the chart above is to show that glucose is not the only molecule that can be used to provide energy to the body.
Proteins and Fats can also be used for this purpose.
Cellular Respiration Reaction Flow Chart as a Metabolic Hub
In the chart above we show the Cellular Respiration Reaction Flow from Glycolysis , to the Transition Phase, to the Krebs Cycle, to the Oxidative Phosphorylation phase.
On top of this foundation we show some of the important metabolic processes that occur “around” it.
Imagine that the Cellular Respiration route is the main freeway and
- connected to it are several other streets (reaction routes) leading to different destinations (products).
- Some of the roads are one way (irreversible reactions) while others are not (reversible reactions).
Fed State and Fasted State
Our metabolic state continuum ranges from being fully satiated and “fed” to being essentially nutrient deprived or “fasted”.
Blood glucose levels are a primary indicator of the fed (high) and fasted (low) states.
In the Fed State:
- Blood glucose is high.
- Insulin hormone released by the pancreas, activates glucose uptake by cells and
- promotes storage as glycogen in the liver and muscle.
In the Fasted State:
- Blood glucose is low.
- Glucagon hormone released by the pancreas, activates the breakdown of glycogen (glycogenolysis) and the synthesis of glucose from non-carbohydrate sources (gluconeogenesis).
- Lactic Acid, Glycerol, some Amino Acids will undergo gluconeogenesis (Fatty Acids will not).
- Fatty Acids can beta-oxidize into Acetyl CoA which can then form Ketone Bodies (another form of energy the body can use).
Red arrows in the chart indicate that the reaction occurs in the fasted state.
I’ve shown some of the reactions (Amino Acids, Cholesterol production, and Pentose Phosphate Pathway) as possibly occurring in both states.
This Is Not A Complete Picture
The primary purpose of this sketch is to show how Proteins (Amino Acids) and Fats (Glycerol and Fatty Acids) can be utilized for energy.
There are many other metabolic reactions going on. In the chart I show two important ones:
- The production of NADPH, Nucleotides, and other products from the Pentose Phosphate Pathway (connected to Glycolysis breakdown intermediates).
- The production of Cholesterol from Acetyl CoA.
Disclaimer: The content of this article is intended for general informational and recreational purposes only and is not a substitute for professional “advice”. We are not responsible for your decisions and actions. Refer to our Disclaimer Page.
