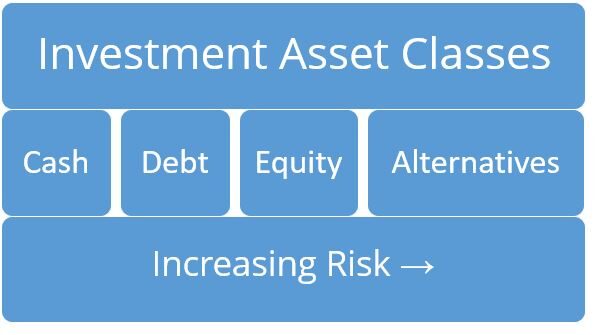
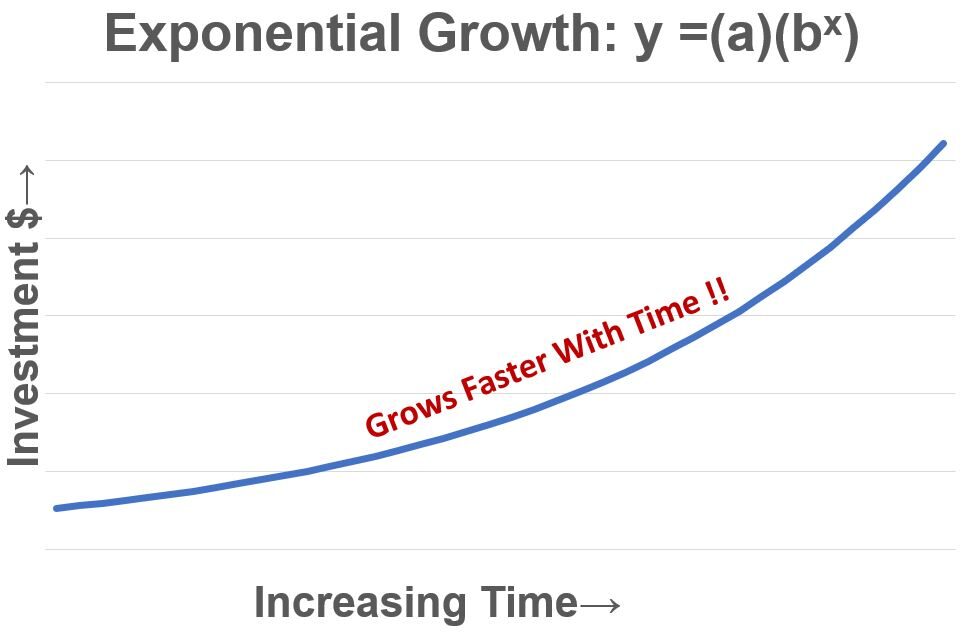
Investments

Investments are assets that individuals own and management with the intent of making a profit and adding to and growing their wealth. Stocks and Bonds are assets for example.

TVM Calculator Keys

Time Value of Money (TVM) Calculator

Linked Menu Last Update: March 9, 2024 Time Value of Money (TVM) Calculator Introduction Time Value of Money Equations General Steps for Using Calculator Calculator Tool Introduction Calculator Tool TVM Examples using Calculator Tool Conclusion Appendix 1 – Time Value of Money Governing Equations (for Fixed Rates) Introduction Time Value of Money The Time Value […]

Time Value of Money (TVM) Calculator Read More »

Subject icon showing asset allocation yearly ranking

Asset Class Performance

Last Revision: November 20, 2022 Asset Class Performance: Introduction Understanding asset class performance is an important part of assembling the proper investment portfolio mix. This post analyzes the historical performance of various assets using ETF and Mutual Fund proxies.    Its purpose is to show  the historical ranked returns of several asset classes. the volatility

Asset Class Performance Read More »

Subject icon for stocks. Candlestick Chart.

Stock and Bond Allocations – Historical Returns

Last Revision: October 17, 2022 Summary In seven graphs, this post shows 94 years of expected returns for various stock and bond allocations. These graphs plot annualized returns for 3, 5, 7, 10, 15, and 20 rolling yearly periods and show that: Variability of outcomes increases (risk increases) as the proportion of stocks relative to

Stock and Bond Allocations – Historical Returns Read More »

Subject icon of calculator and pencil and eraser symbolizing financial calculations

How to Calculate a Moving Average (Rolling Average)

Last Revision: October 17, 2022 Summary Moving average (rolling average) computations help us analyze trends. They are often applied to time series data analysis where short term fluctuations are dampened out. As a result, the investor gleans further insight by studying the “smoothed” data. This post shows how to compute the moving average with two

How to Calculate a Moving Average (Rolling Average) Read More »

S&P 500 TR Daily Close 1/1988-7/2022

S&P500 Index Performance with Best Days Removed

Last Revision: August 14, 2022 Summary This post describes how the long term performance of the S&P 500 Total Return Index is affected when some of the best days are removed.  Introduction   I was recently perusing Chapter 2 of my copy of Charles D. Ellis’s book, “Winning the Losers Game” (3rd Edition, New York,McGraw-Hill,1998). The

S&P500 Index Performance with Best Days Removed Read More »

Subject icon of calculator and pencil and eraser symbolizing financial calculations

How to Calculate The Compound Annual Growth Rate (CAGR)

Last Revision: October  17, 2022 Introduction  CAGR, the Compound Annual Growth Rate, is used to compute financial returns.  In this post, we’ll describe how to compute the CAGR by first laying down some foundational concepts and then going through a few graphical examples. As you read this post, keep the following in mind. The asterisk

How to Calculate The Compound Annual Growth Rate (CAGR) Read More »

Subject icon for stocks. Candlestick Chart.

Historical S&P 500 U.S. Stock Performance

Last Revision: October 17, 2022 Introduction This article describes the historical performance of the U.S. Stock Market as represented by the S&P 500 index. It also provides some useful learnings that can be applied to our investment decisions. As you read through the material, please refer to the Financial Glossary which will open as a

Historical S&P 500 U.S. Stock Performance Read More »