Metabolic Routes
Tissue Specific Metabolism Charts
Last Update: November 4, 2024
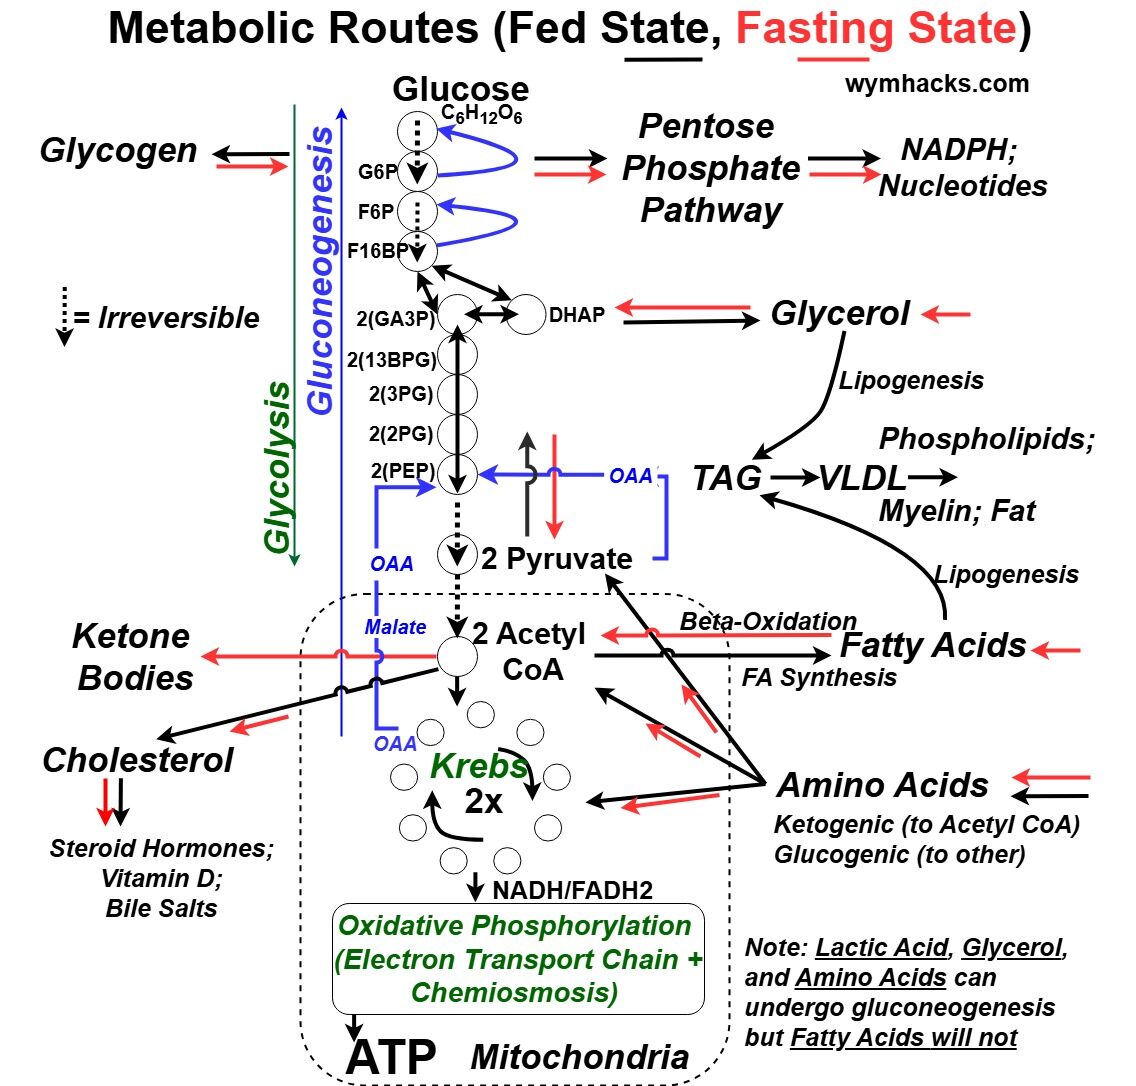
In the picture below we see how the Cellular Respiration reaction pathway is a hub for many other reactions.
It is sometimes called Central Metabolism for this reason.
Picture_Metabolic Routes and Central Metabolism
- Glucose goes to Glycogen and vice versa depending on your metabolic state (Fed and Fasted respectively)
- Gluconeogenesis , roughly speaking is Glycolysis in reverse, where Glucose is made.
- This would occur in a Fasting (Fasted) State, where energy is needed and glucose levels in the blood are low.
- See the blue lines in the drawing above.
- Glycerol, Lactic Acid, and Amino Acids can convert to Glucose via this mechanism (but not Fatty Acids).
- Amino Acids convert to Krebs Cycle intermediates and can be used directly in Cellular Respiration for energy (ATP) production.
- Acetyl Co produces Fatty Acids and vice versa (Beta-Oxidation) depending on your Metabolic State (Fed or Fasted State respectively)
- Acetyl Co converts to Ketone Bodies, another molecular form of energy that the Brain (especially) can use in a Fasted State.
- Other biosynthetic reactions occur as well like Cholesterol production from Acetyl CoA and NADPH and Nucleotides via the Pentose Phosphate Pathway.
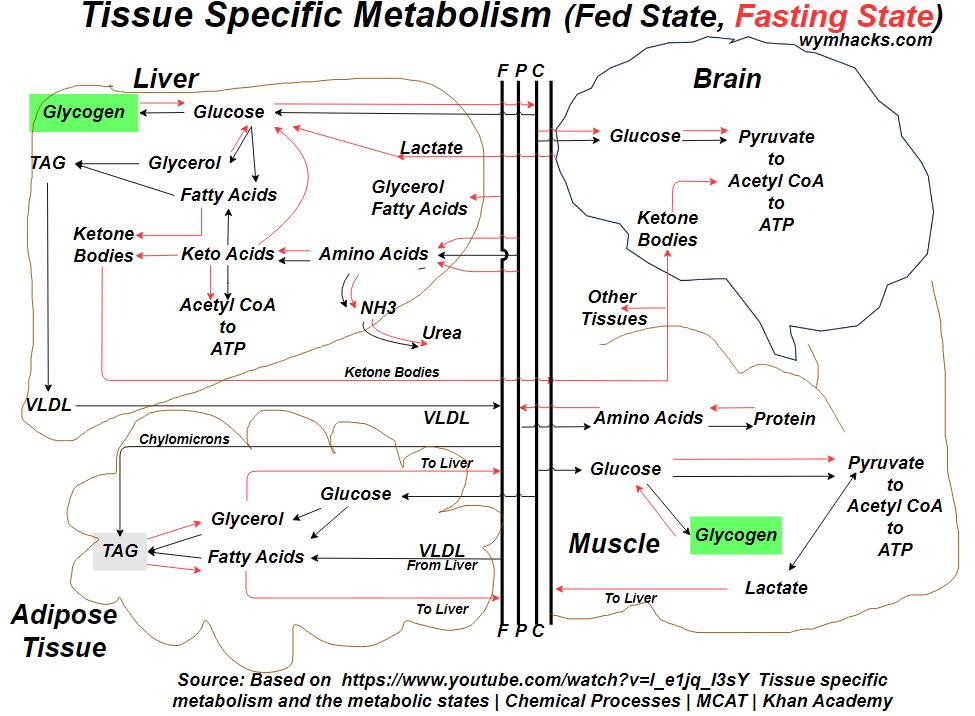
Another way to look at Metabolic Routes is from a tissue specific perspective as shown in the two drawings below.
Picture_Tissue Specific Metabolic Routes Version 1
These drawings are based on this video:Tissue specific metabolism and the metabolic states- Khanacademy.org
Picture_Tissue Specific Metabolic Routes Version 2
 There is great complexity and bi-directionality in Metabolic Reaction Pathways which cannot fairly be depicted in one diagram.
So use these drawings for a general appreciation of the possible metabolic routes and consult a good biochemistry text for details (e.g. Lehninger “Principles of Biochemistry” or others)
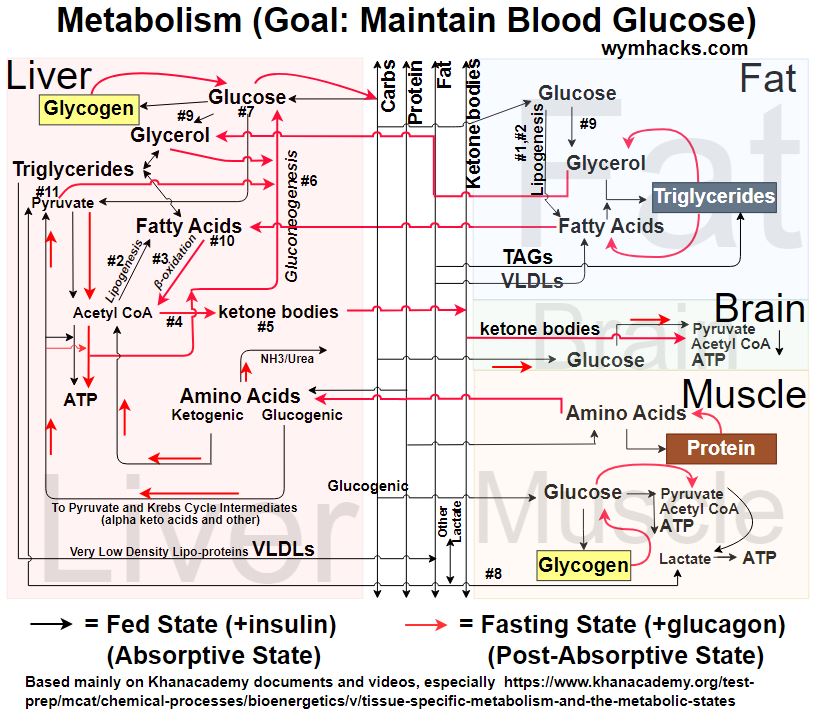
Refer to the numbers in the above drawing when you read the descriptions below.
- #1: Lipogenesis from Glucose: Glucose–>Acetyl CoA –> Fatty Acid (FA)
- #2: Lipogenesis occurs in cytoplasm outside Mitochondria
- #3: Fatty Acid (FA) oxidation occurs inside Mitochondria
- #4: Ketogenesis: FAs usually largest Ketone Body producer
- #5: Ketone bodies can be used by Brain, Muscle, Heart
- #6: Gluconeogenesis occurs in cell cytoplasm of Liver (mainly) & Kidneys
- #7: Glucose –>Pyruvate–>Acetyl CoA–>Palmitic Acid (C16H32O2)
- #8: Lactate produced by muscle, red blood cells, and others
- #9: Glycerol produced from the Glycolysis reaction pathway (via DHAP)
- #10: Fatty Acids cannot be converted to Glucose
- #11: Pyruvate reversibly can be made from Alanine as well as Lactate. Pyruvate enters gluconeogenesis pathway irreversibly via Oxaloacetate.
Disclaimer: The content of this article is intended for general informational and recreational purposes only and is not a substitute for professional “advice”. We are not responsible for your decisions and actions. Refer to our Disclaimer Page.


